Unternavigation
Social Security in Numbers
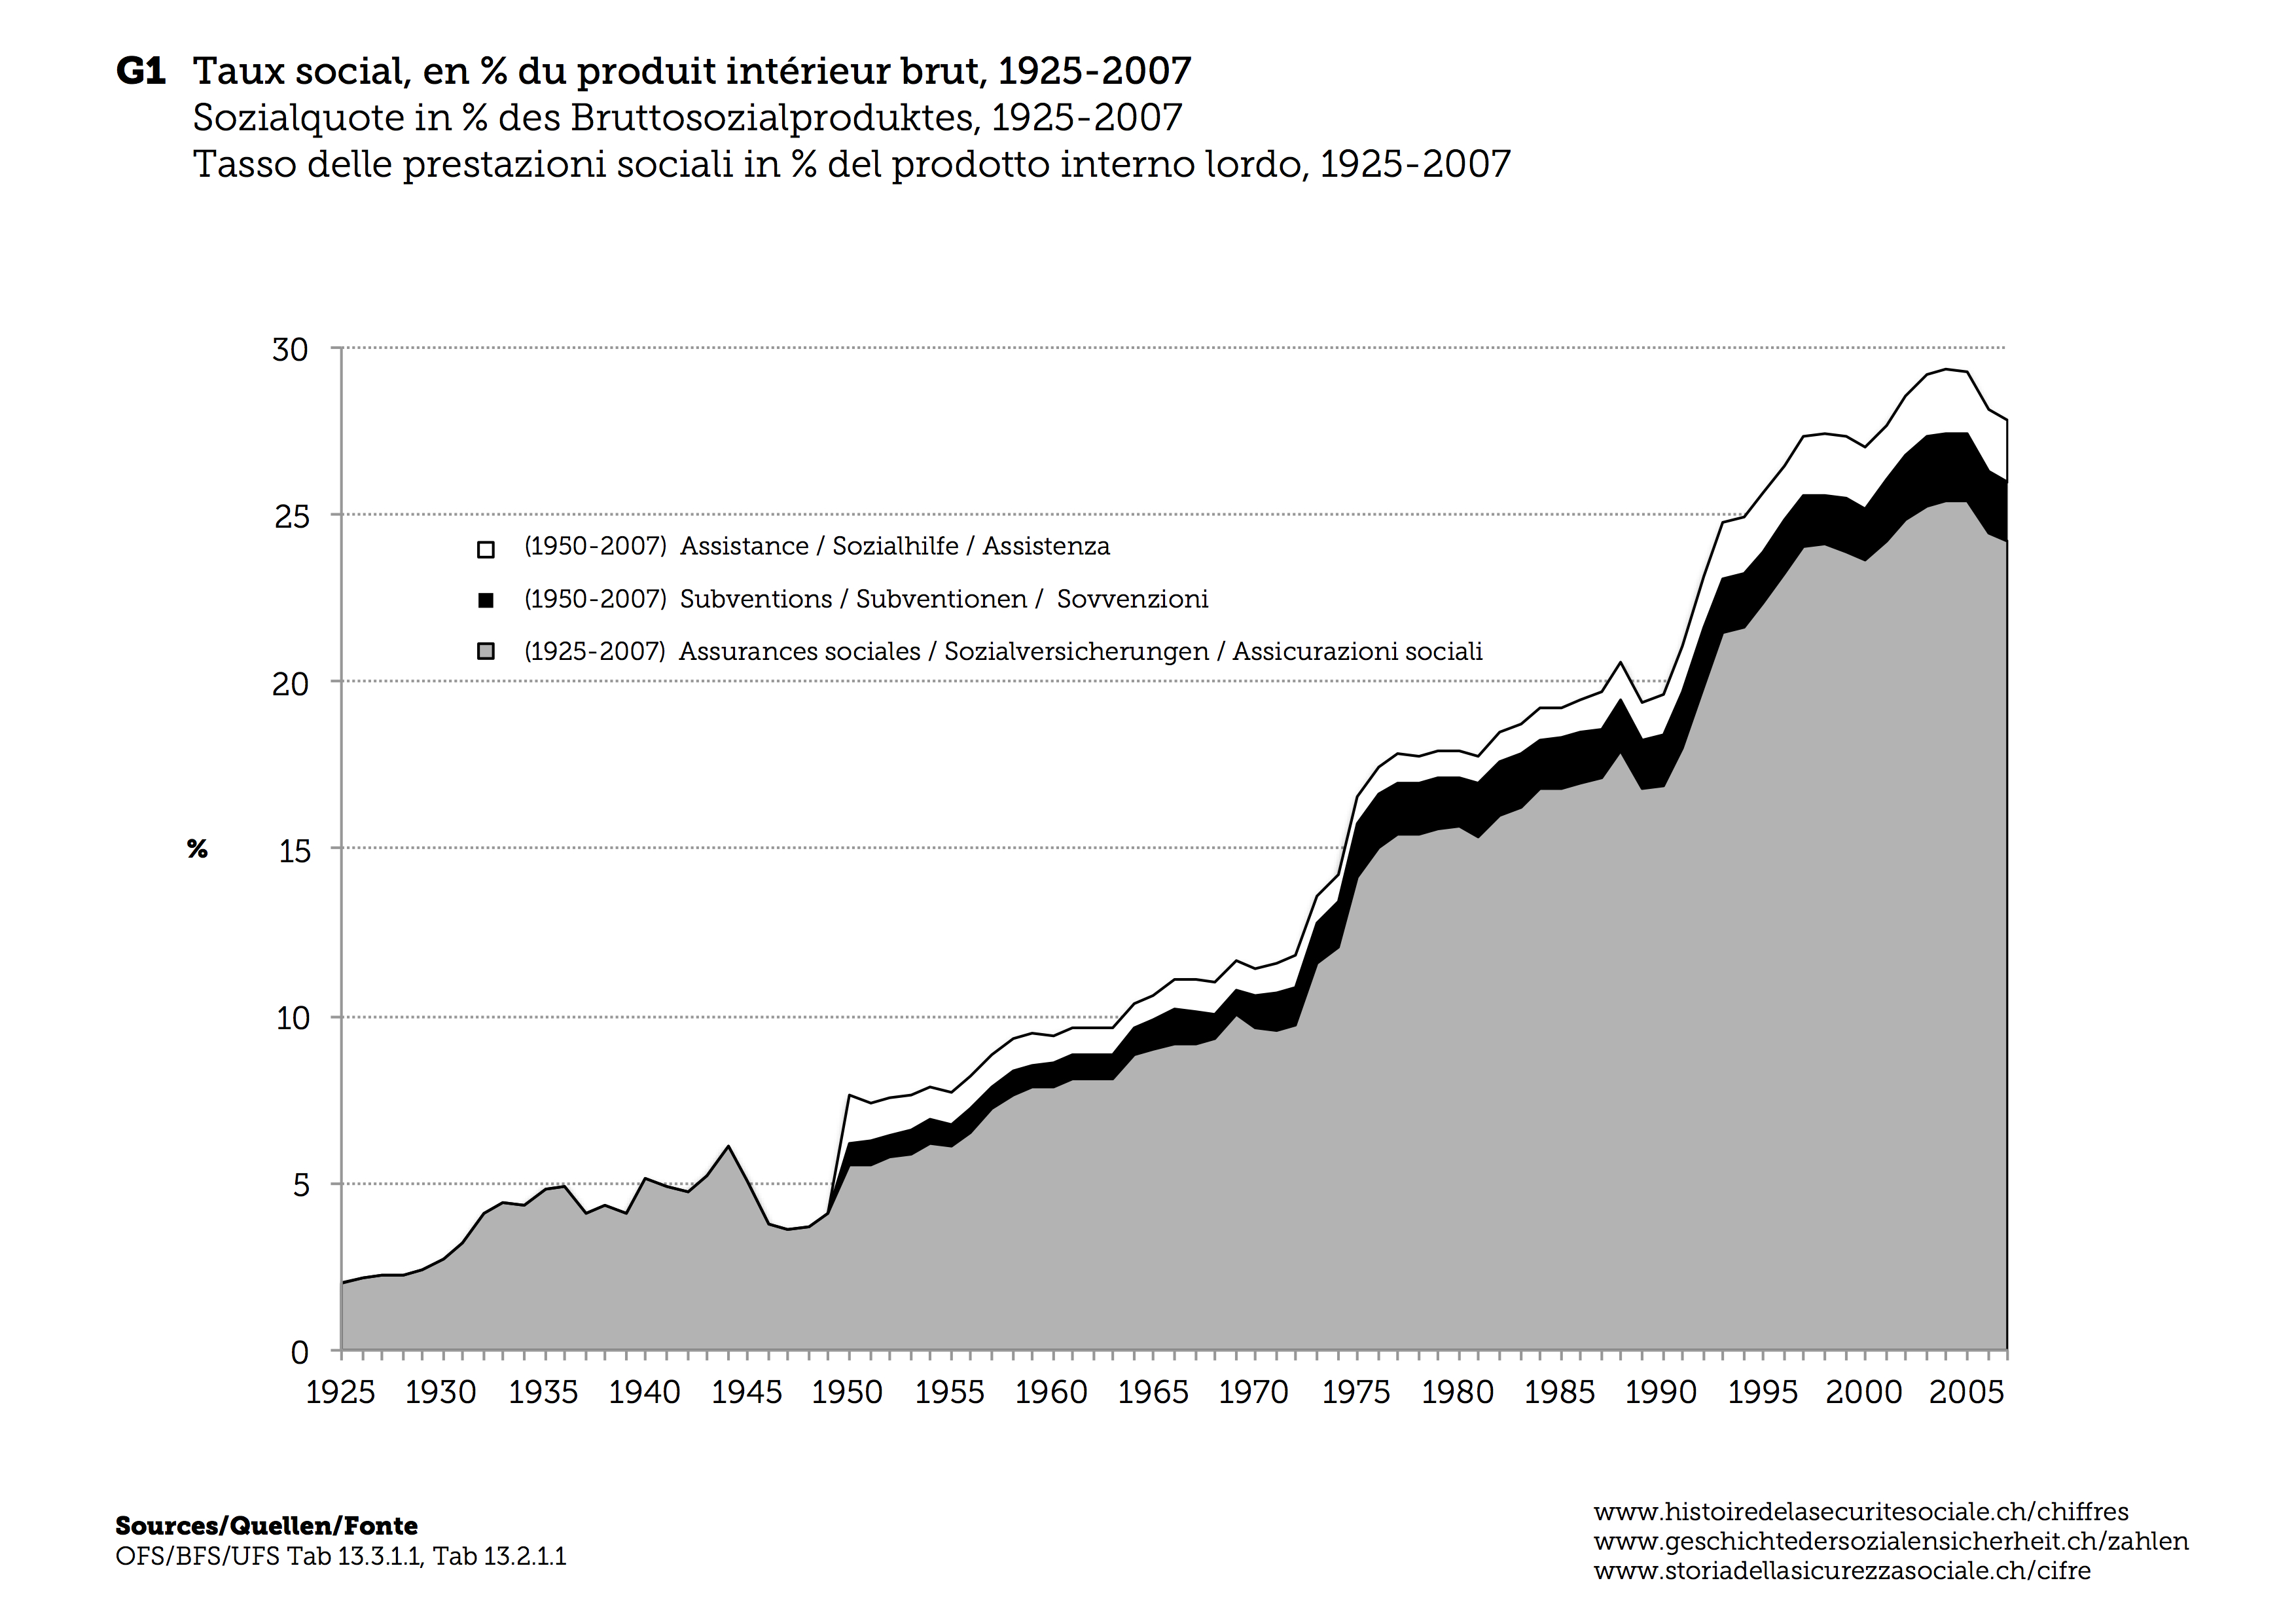
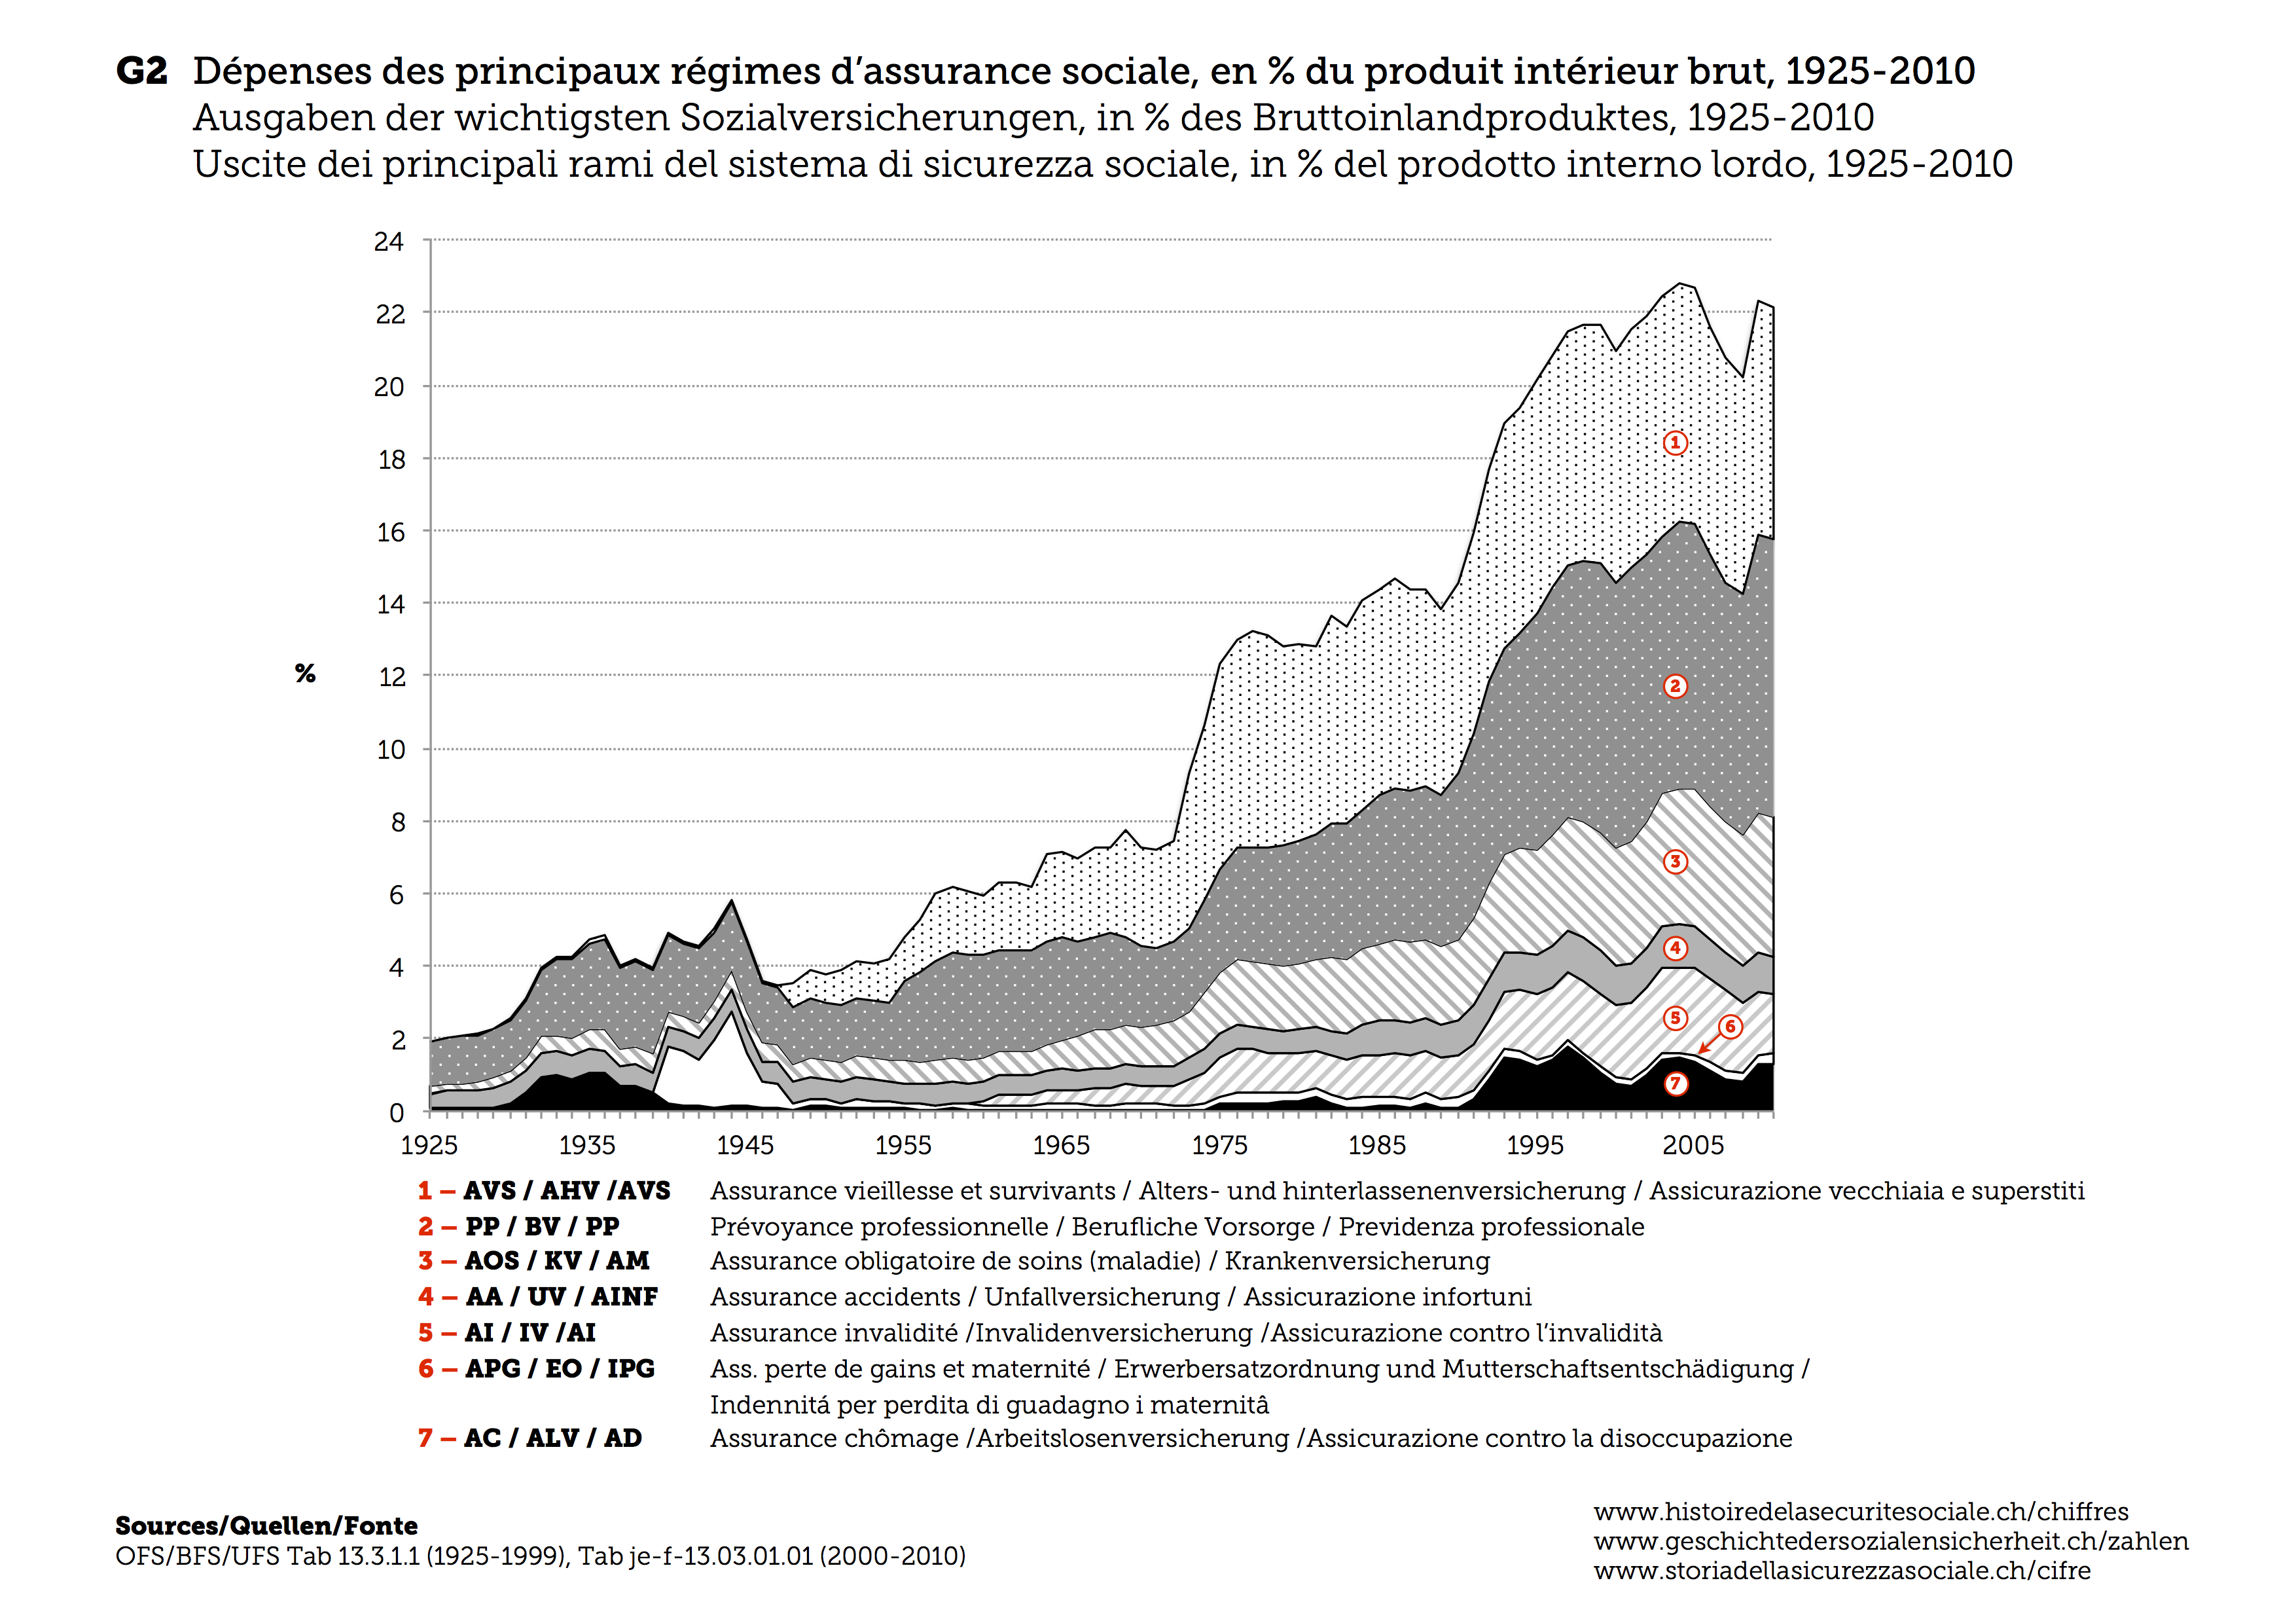
The development of social security is often measured using the so-called social expenditure ratio. This ratio comprises the sum total of expenditures for social insurance programs (such as pensions paid out by AHV, IV or pension funds), means-tested welfare benefits (supplementary benefits for AHV or social welfare benefits) and subsidies (namely for hospitals and facilities for people with disabilities) as a ratio of gross domestic product (F1). Since 1925, the vast majority of expenditure was attributable to social insurance programs (AHV and occupational provision, disability, illness, accident, unemployment, loss of earnings and maternity). (F2). For the period before 1950, there are no reliable estimates regarding means-tested welfare benefits or other state subsidies for social welfare and healthcare.
The 20th century trend of social security expenditures can be divided into three phases (F1). In the first phase (1925-1950), social insurance programs were still relatively rare. During the interwar years, the expansion of industrial accident insurance (1918) and of the first pension and unemployment funds (particularly during the crisis of the 1930s) remained limited. An initial spike in expenditure came during the Second World War as a result of the introduction of income compensation insurance (EO, 1940). After a brief period of ‘social demobilization’, a second phase of expansion began after the establishment of the AHV in 1947. The social expenditure ratio tripled during this period (1950-1990). This increase was due to the expansion of old age provision, the establishment of disability insurance (1959) as well as the introduction unemployment insurance (1976). The expansionary momentum at the beginning of the 1970s can be traced back partly to the eighth AHV revision (1973-1975) and the accelerated development of pension funds in the decade prior to the introduction of the Federal Law on Occupational Provision (BVG, 1985). Furthermore, GDP growth went into steady decline from the 1970s onwards, further contributing to a higher social expenditure ratio. This development repeated itself during the crisis of the 1990s. Since the beginning of the 21st century, the social expenditure ratio has levelled off at around 25-28 per cent of gross domestic product.
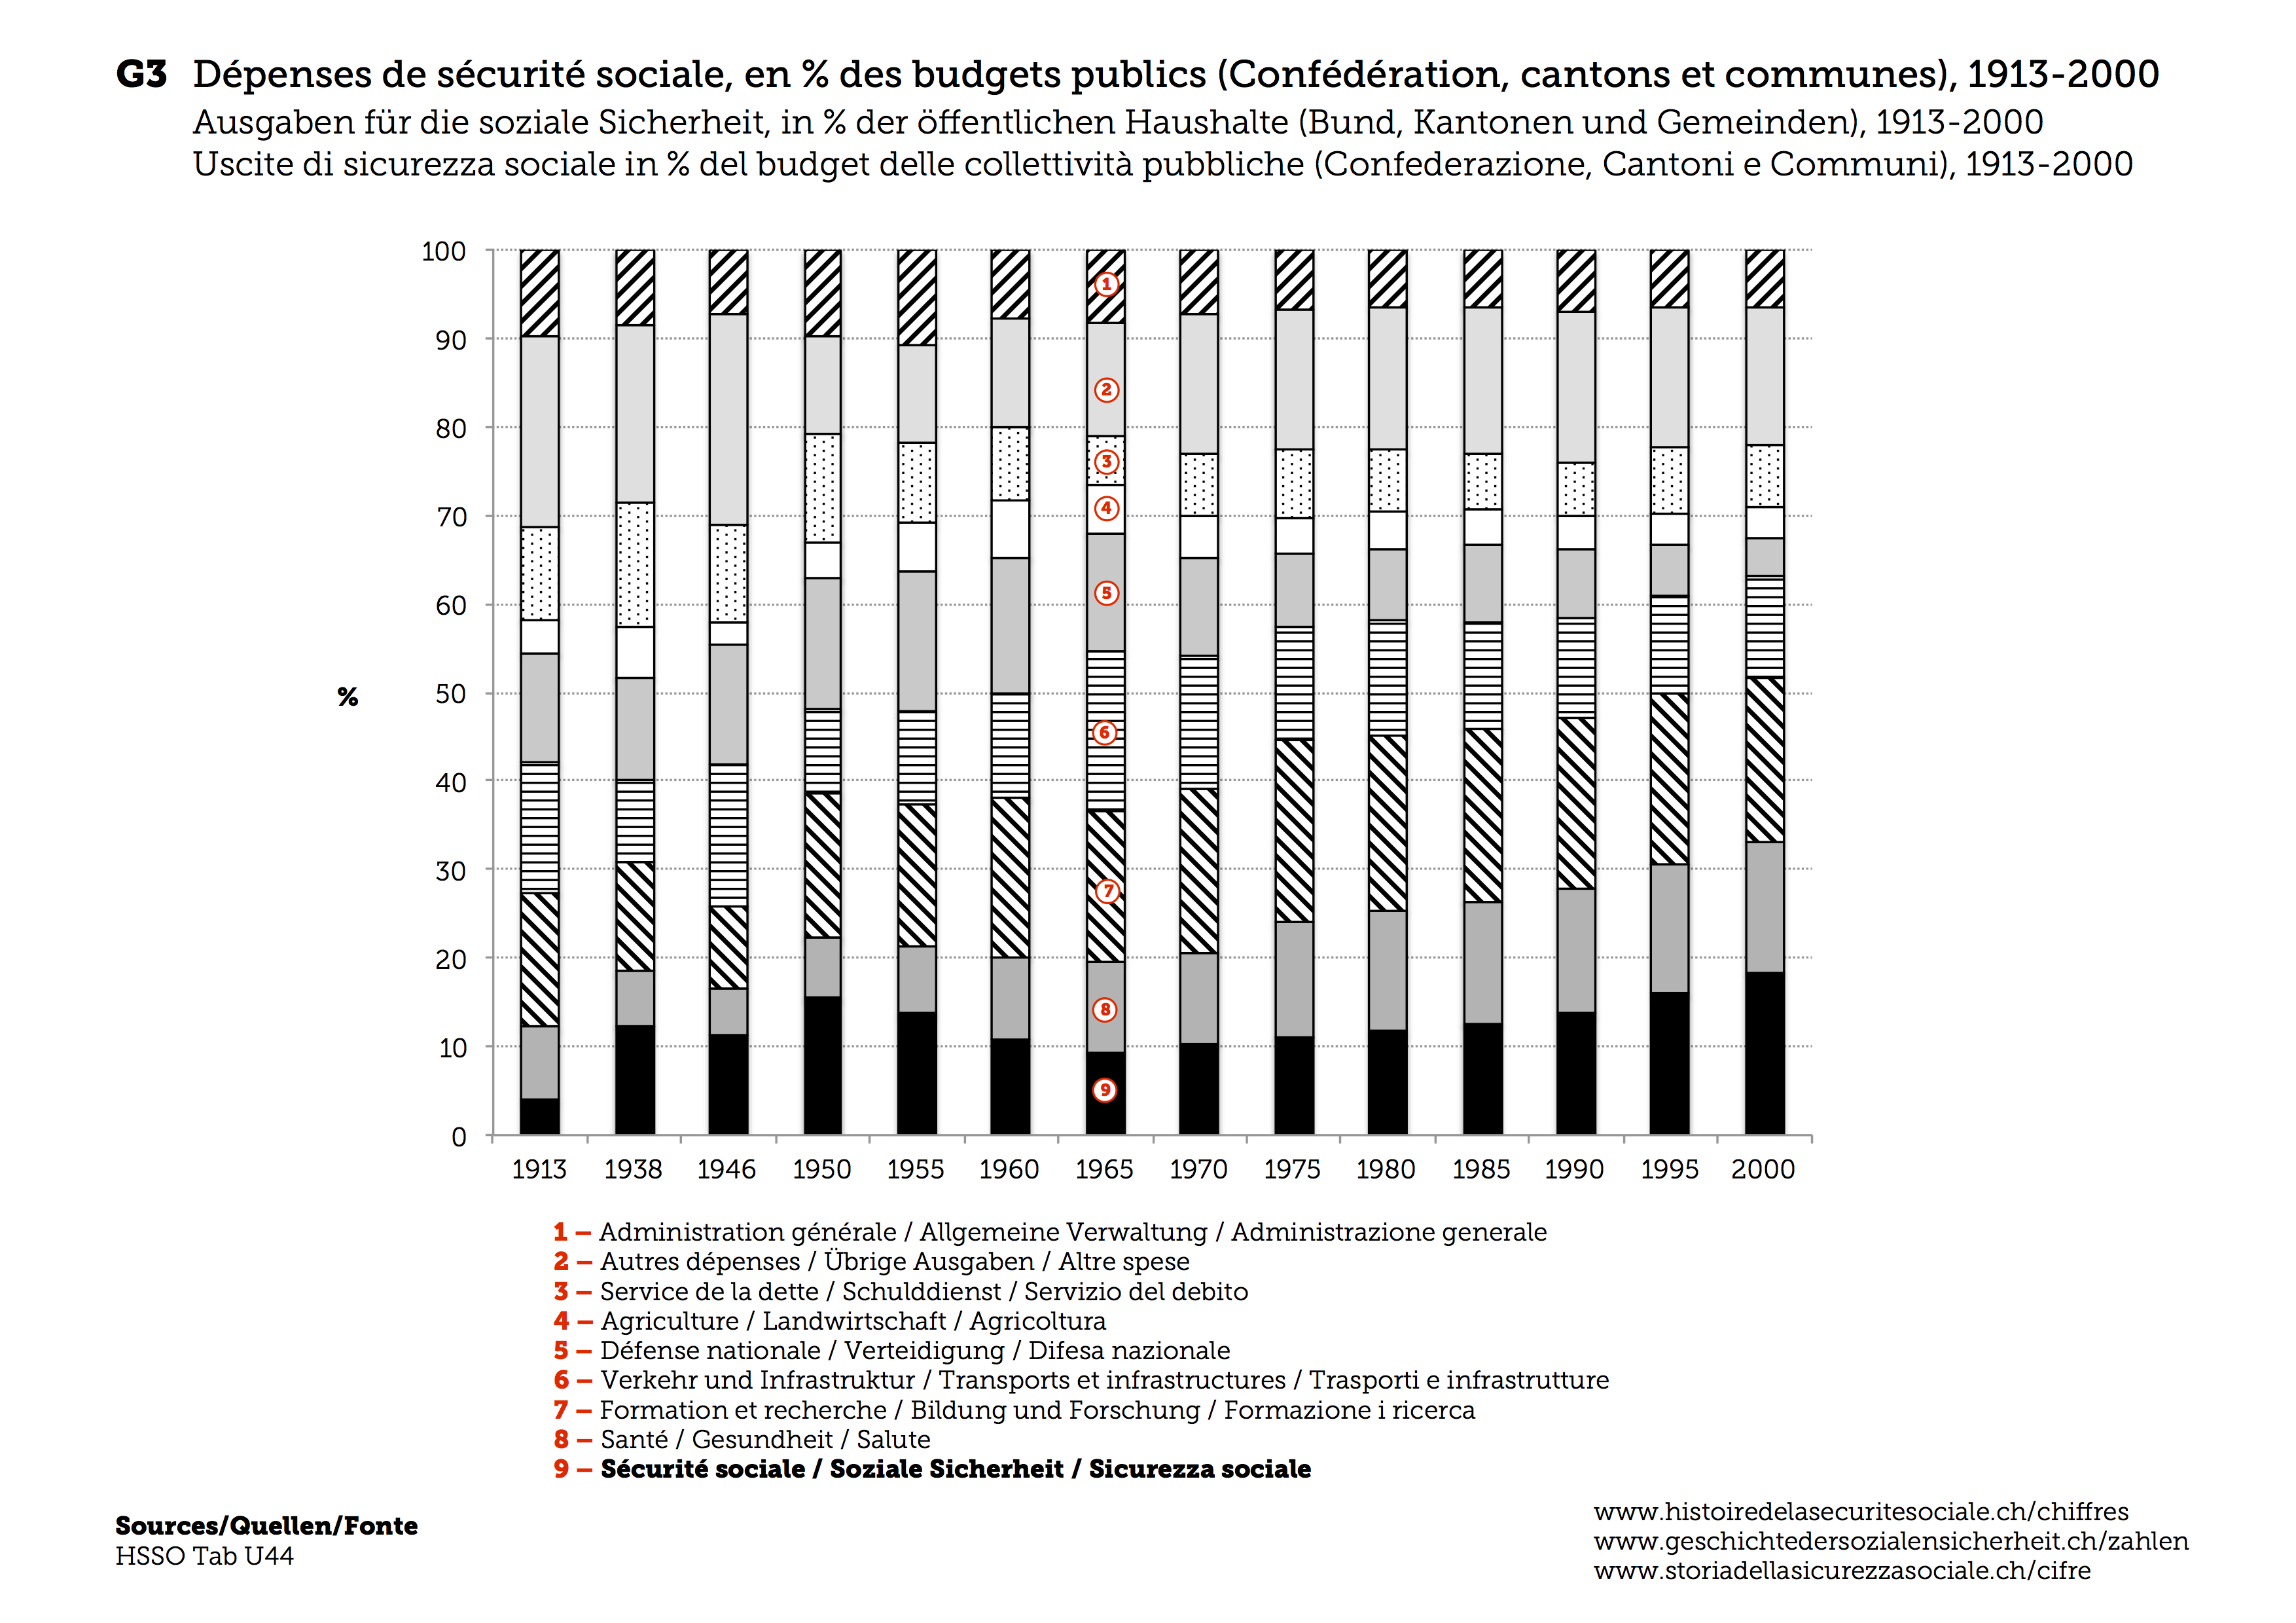
Social security still played a subordinate role in state expenditure immediately before the First World War. (F3). However, the developments described above resulted in fundamental changes: at the beginning of the 21st century, social security – combined with education and research expenditures – constituted the largest block in state expenditure. Altogether, social security and healthcare account for more than a third of public spending.
Figures
F1 Social expenditure ratio as a percentage of gross domestic product, 1925-2007
(12/2015)