Unternavigation
Figures
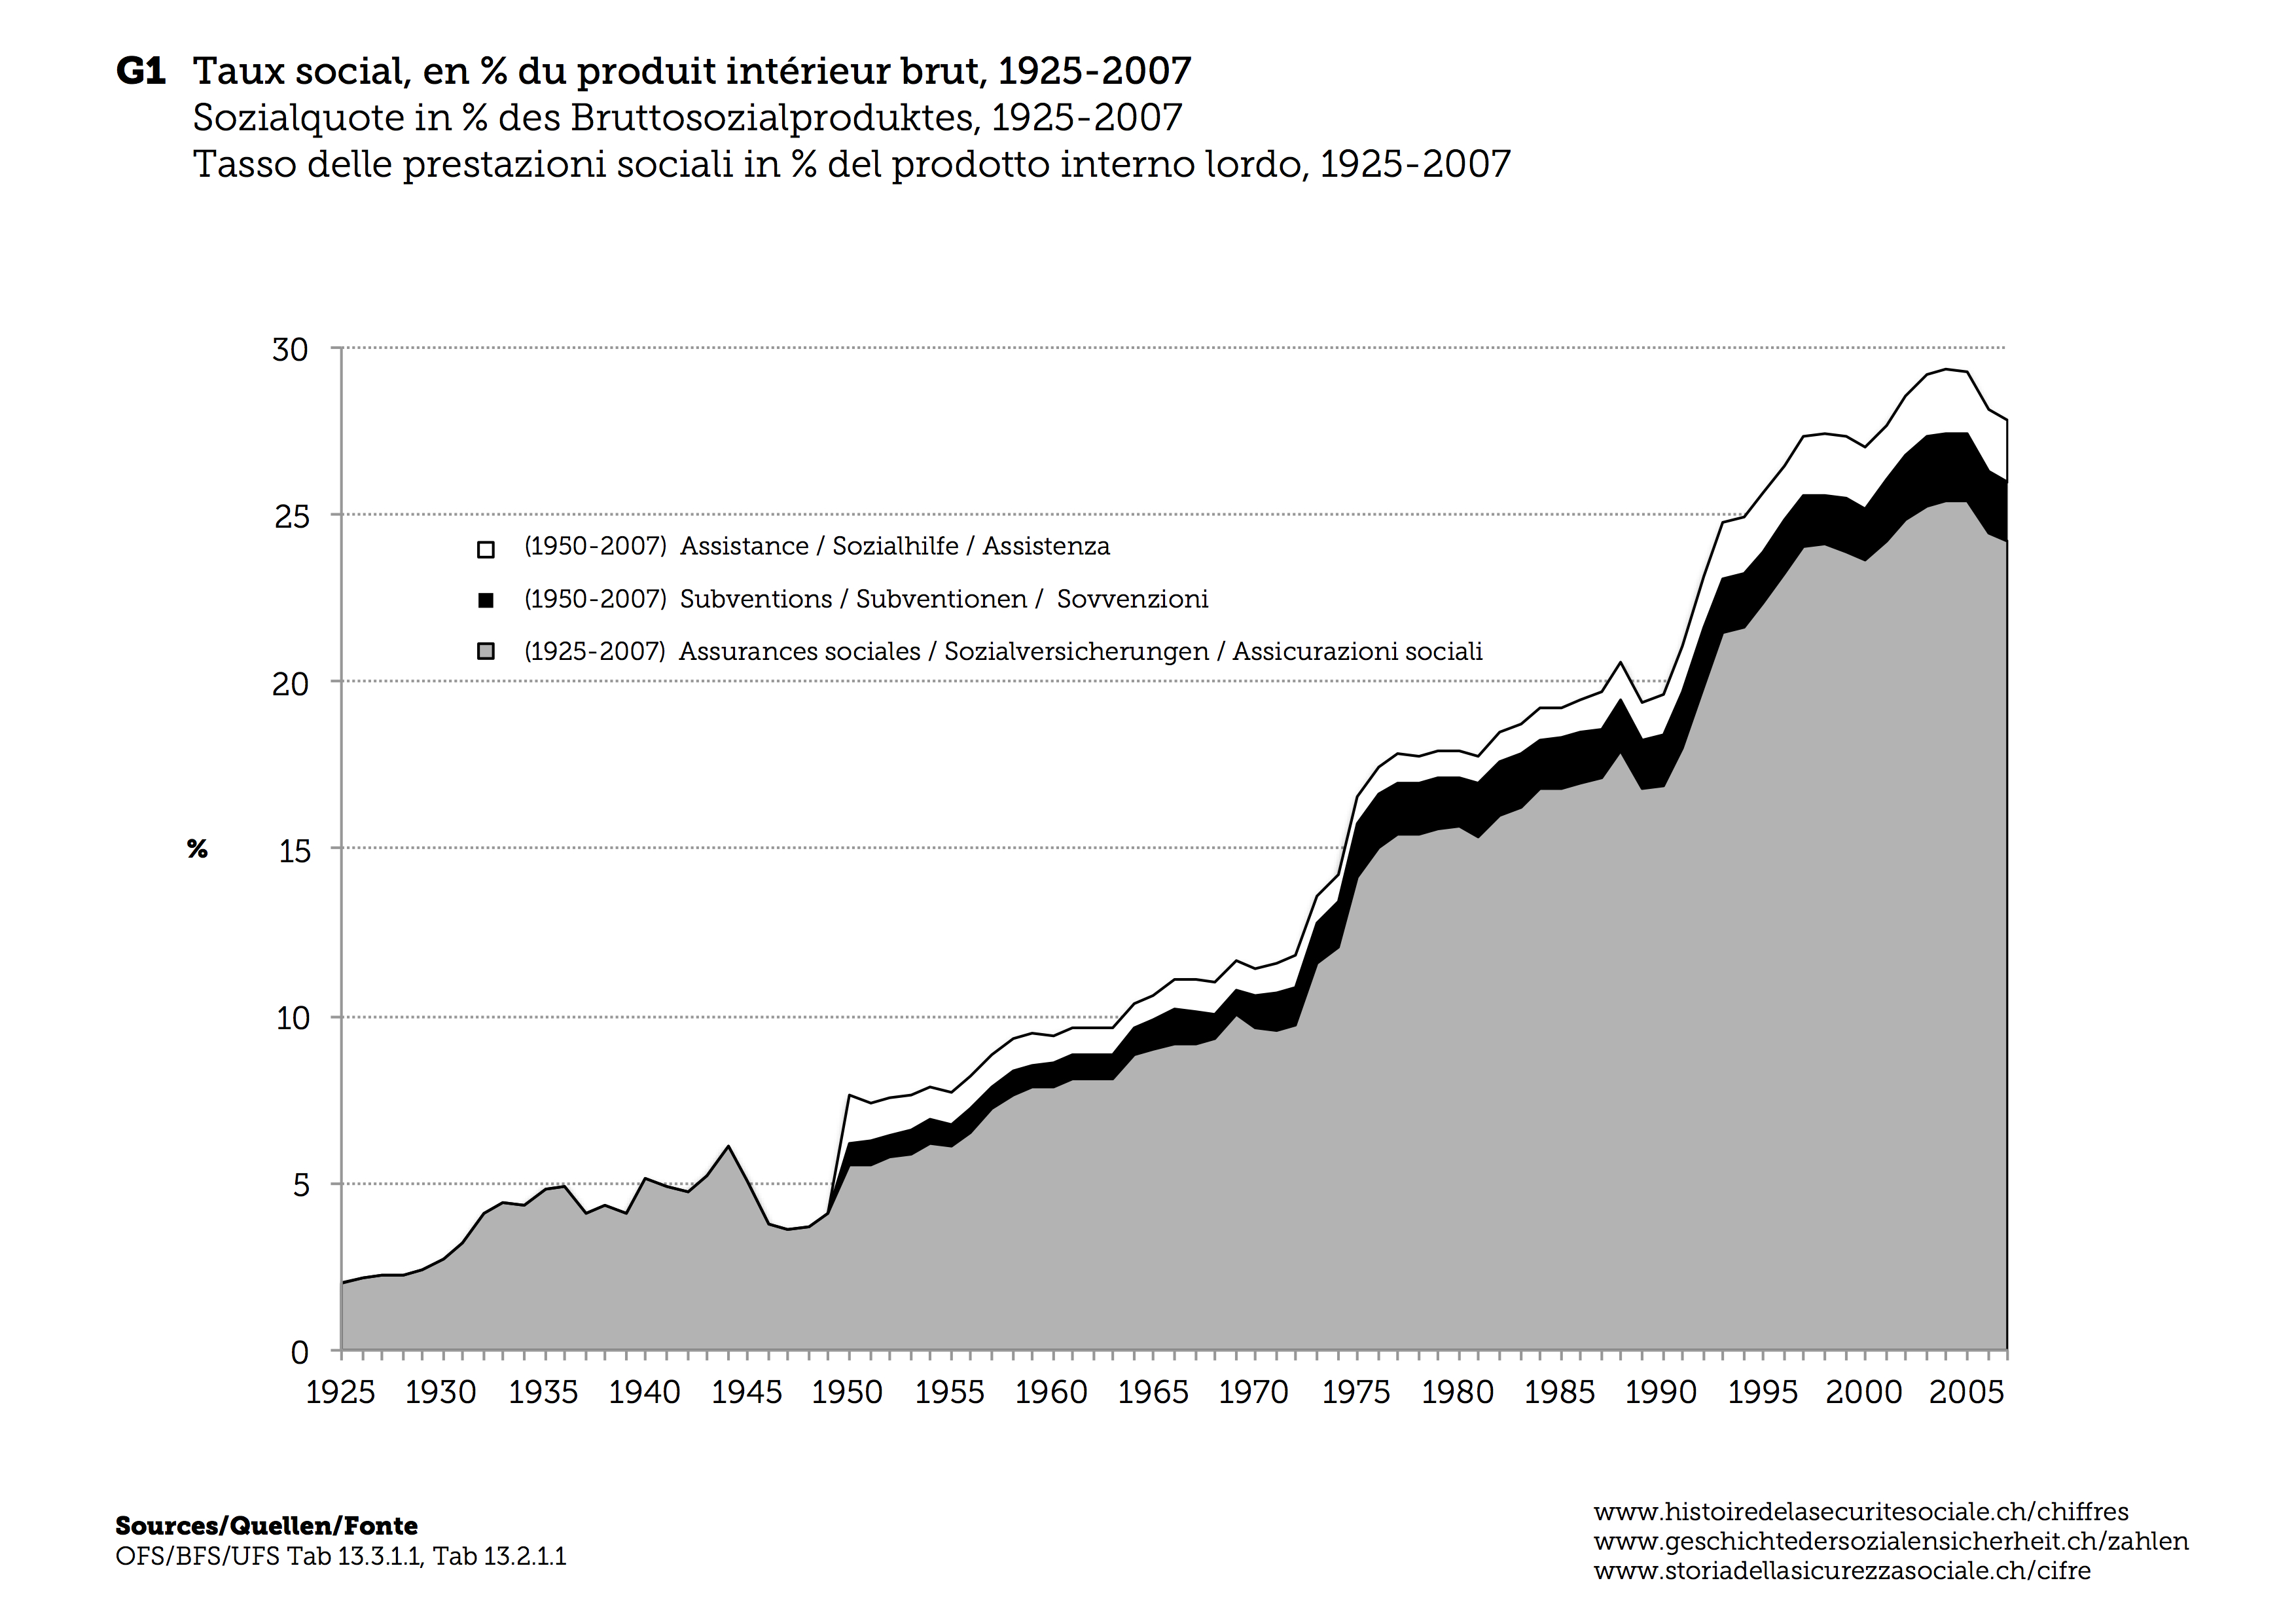
F1 Social expenditure ratio as a percentage of gross domestic product, 1925-2007
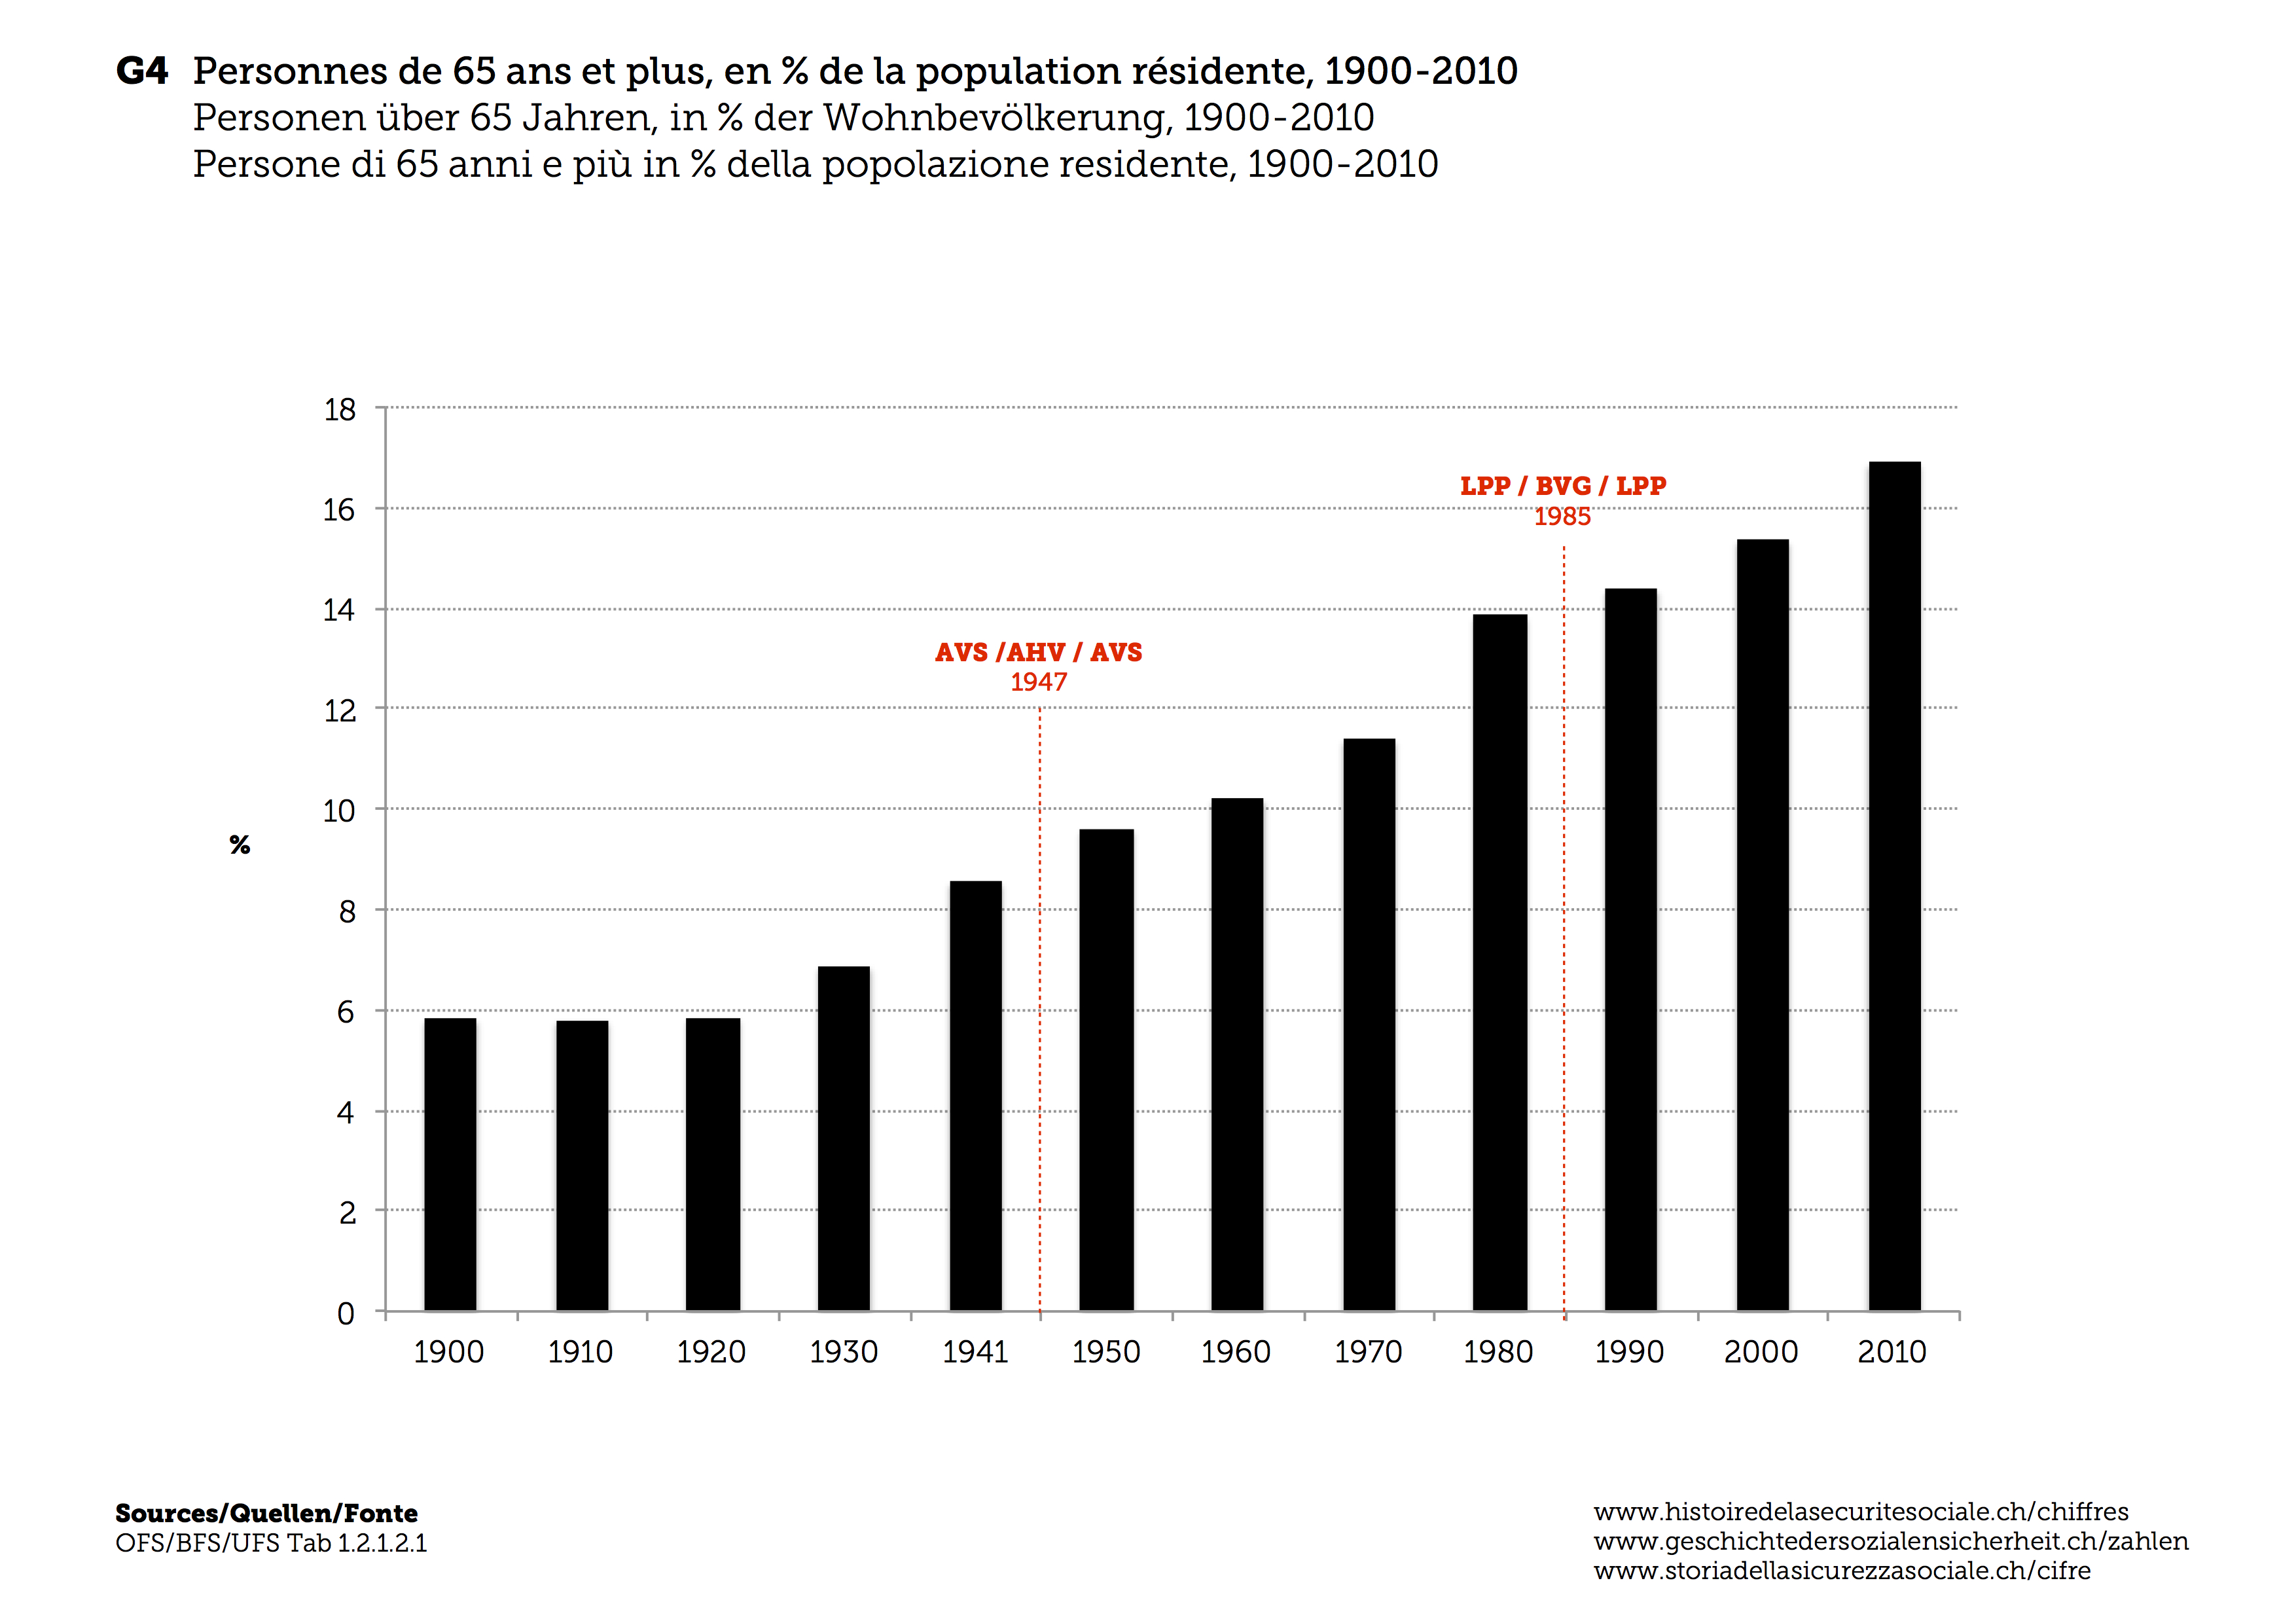
F4 People aged 65 years and more as a percentage of the population, 1900-2010
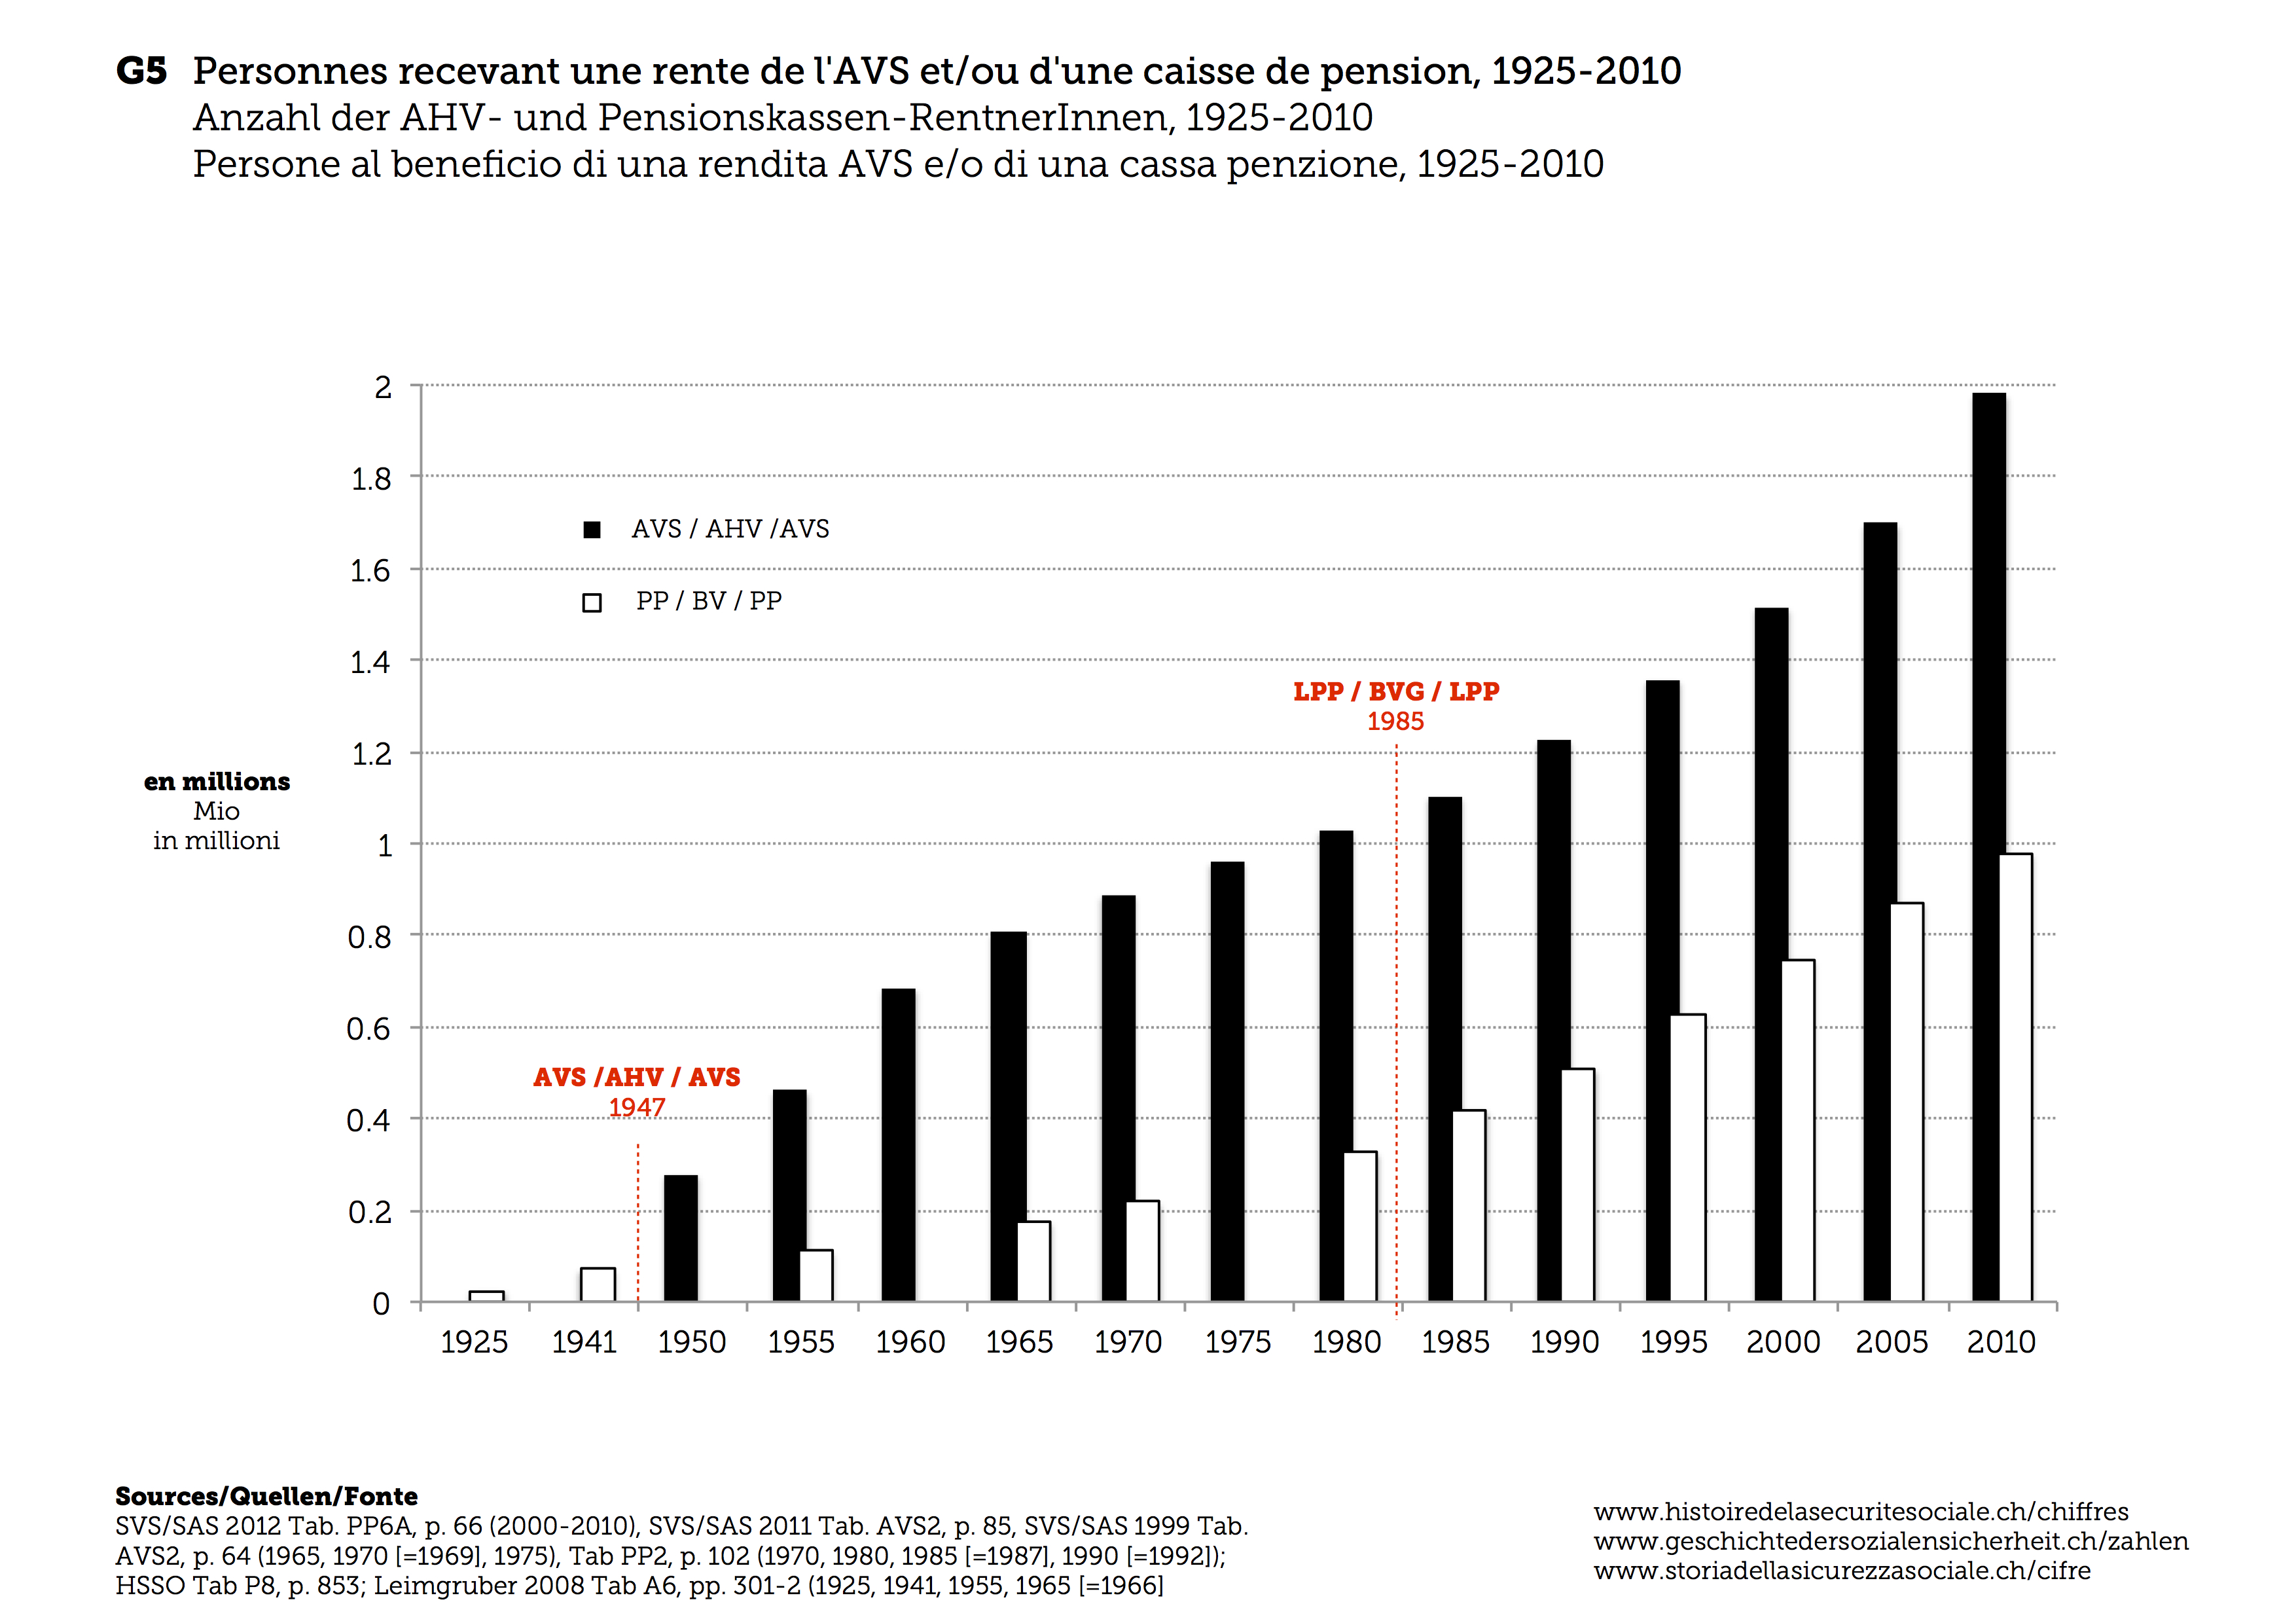
F5 Number of recipients of AHV and pension funds benefits, 1925-2010
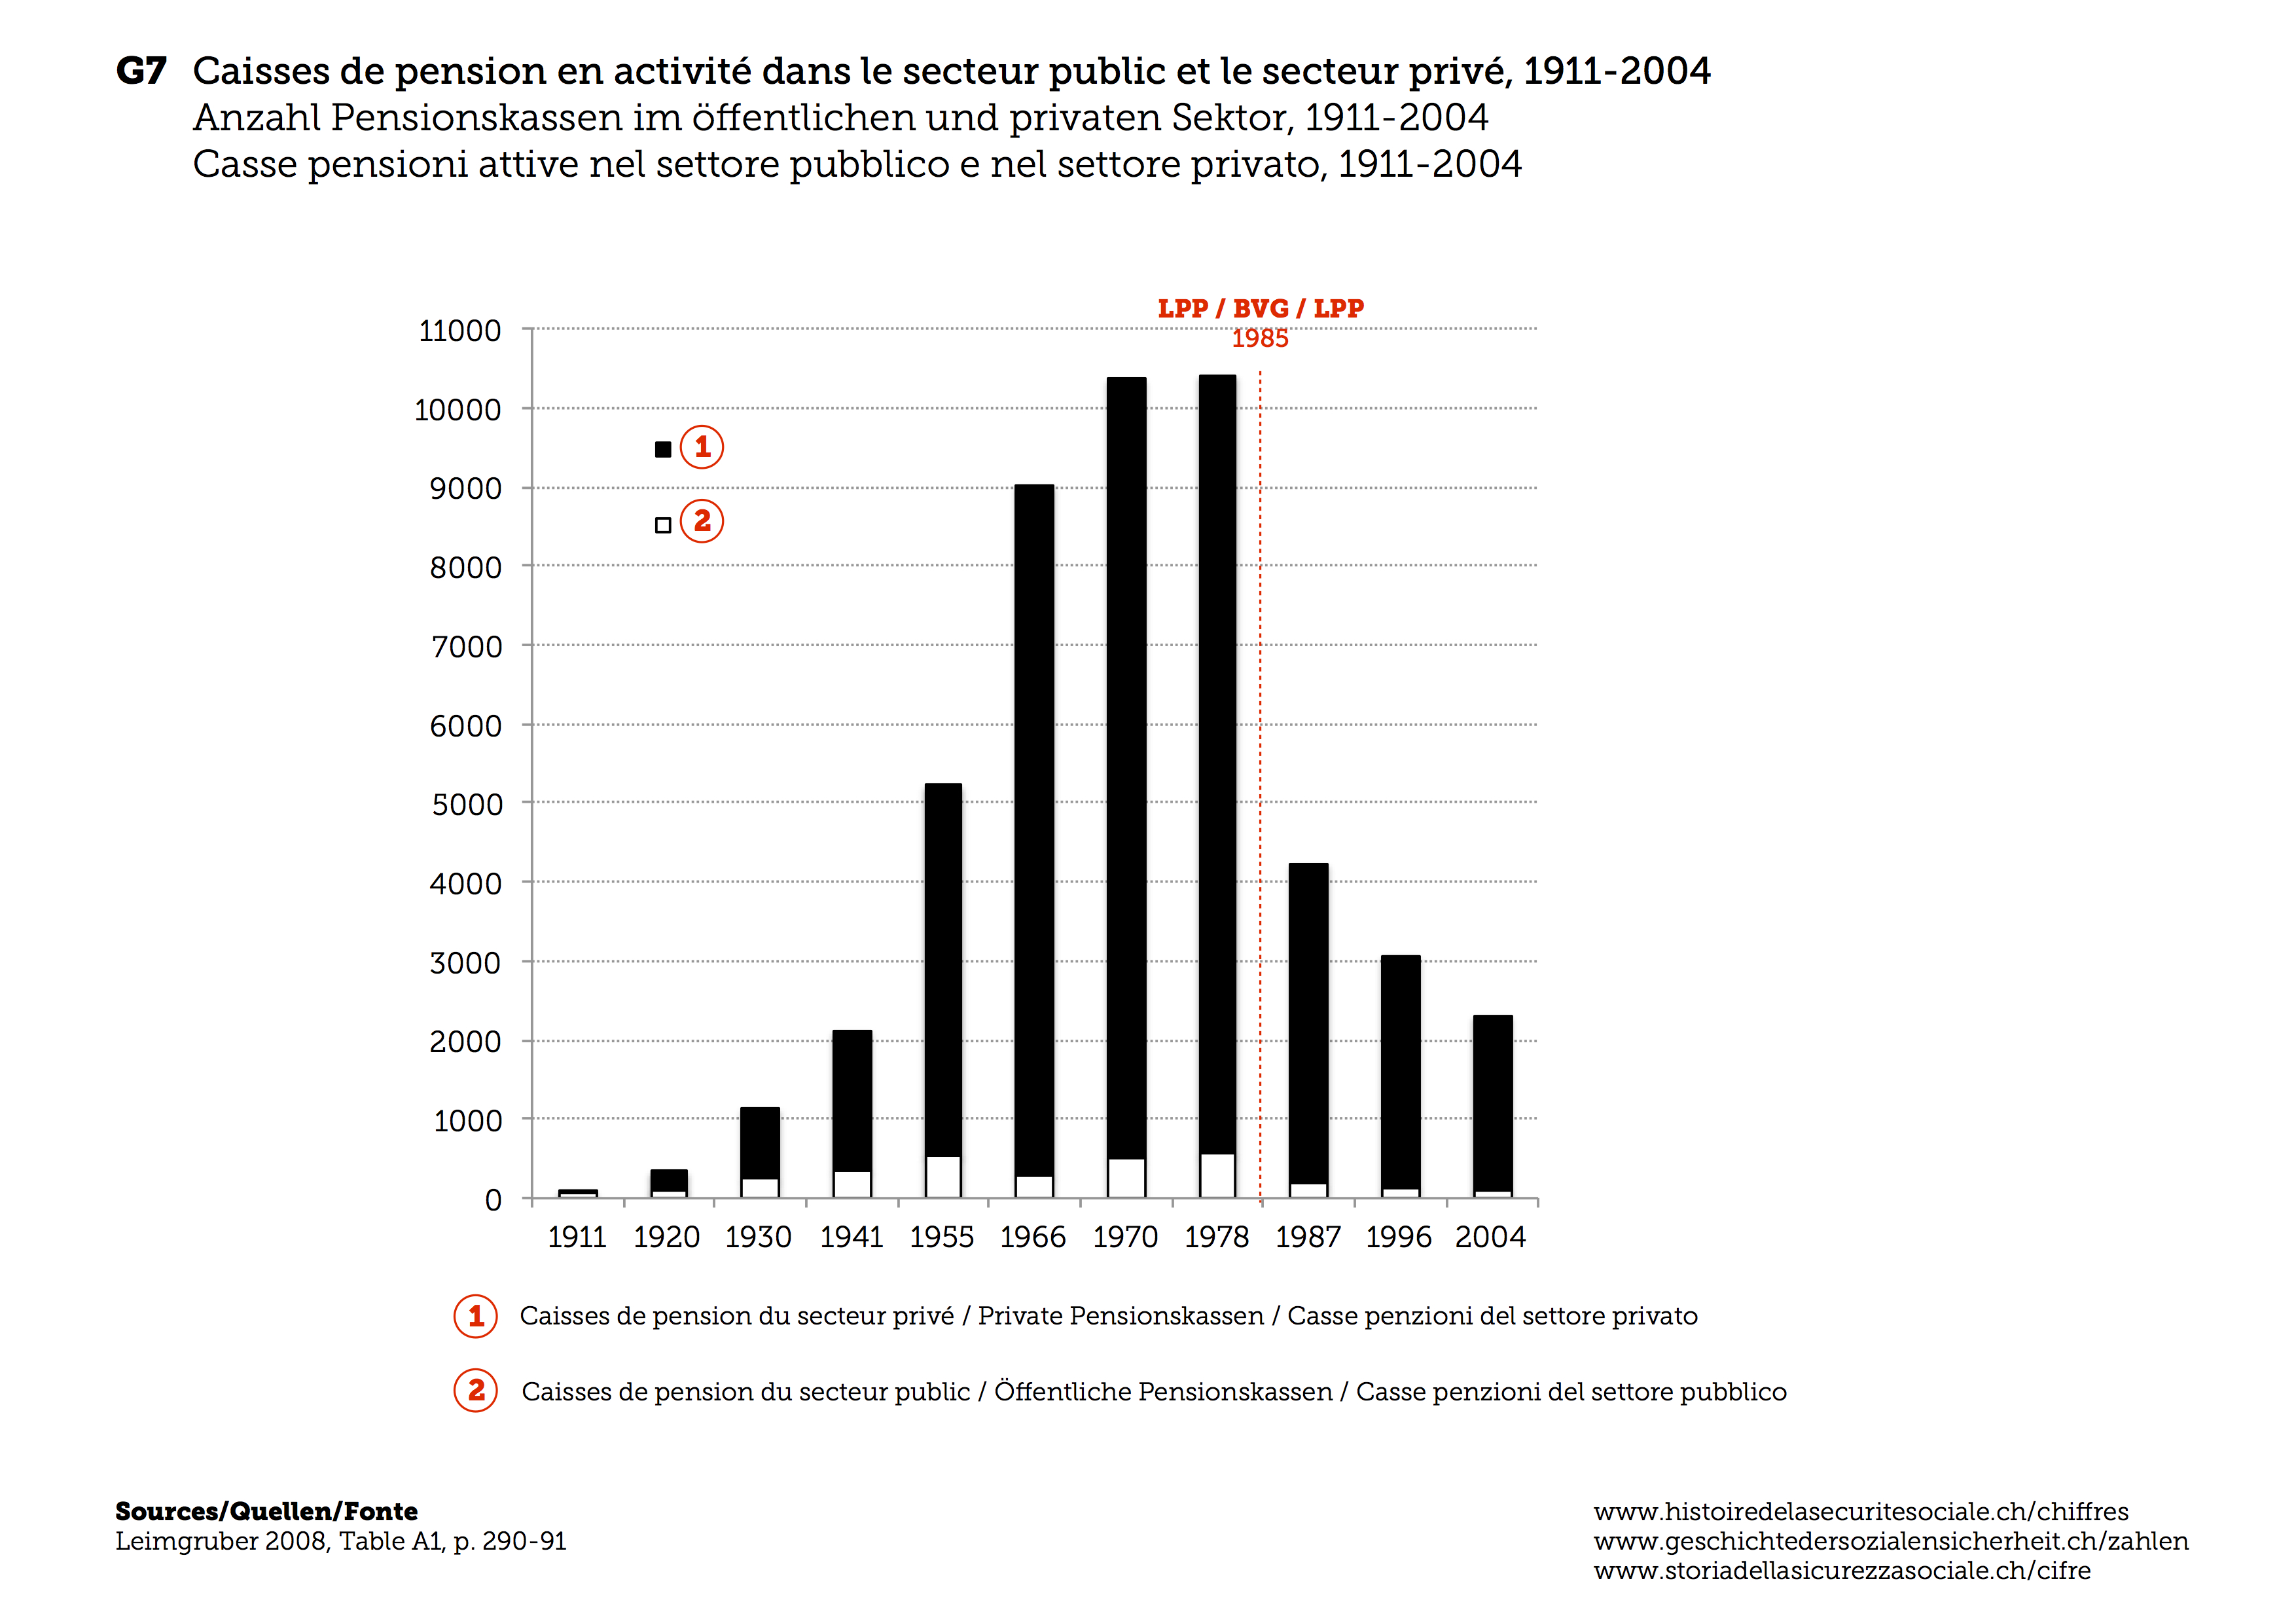
F7 Number of pension funds in the public and private sector, 1911-2004
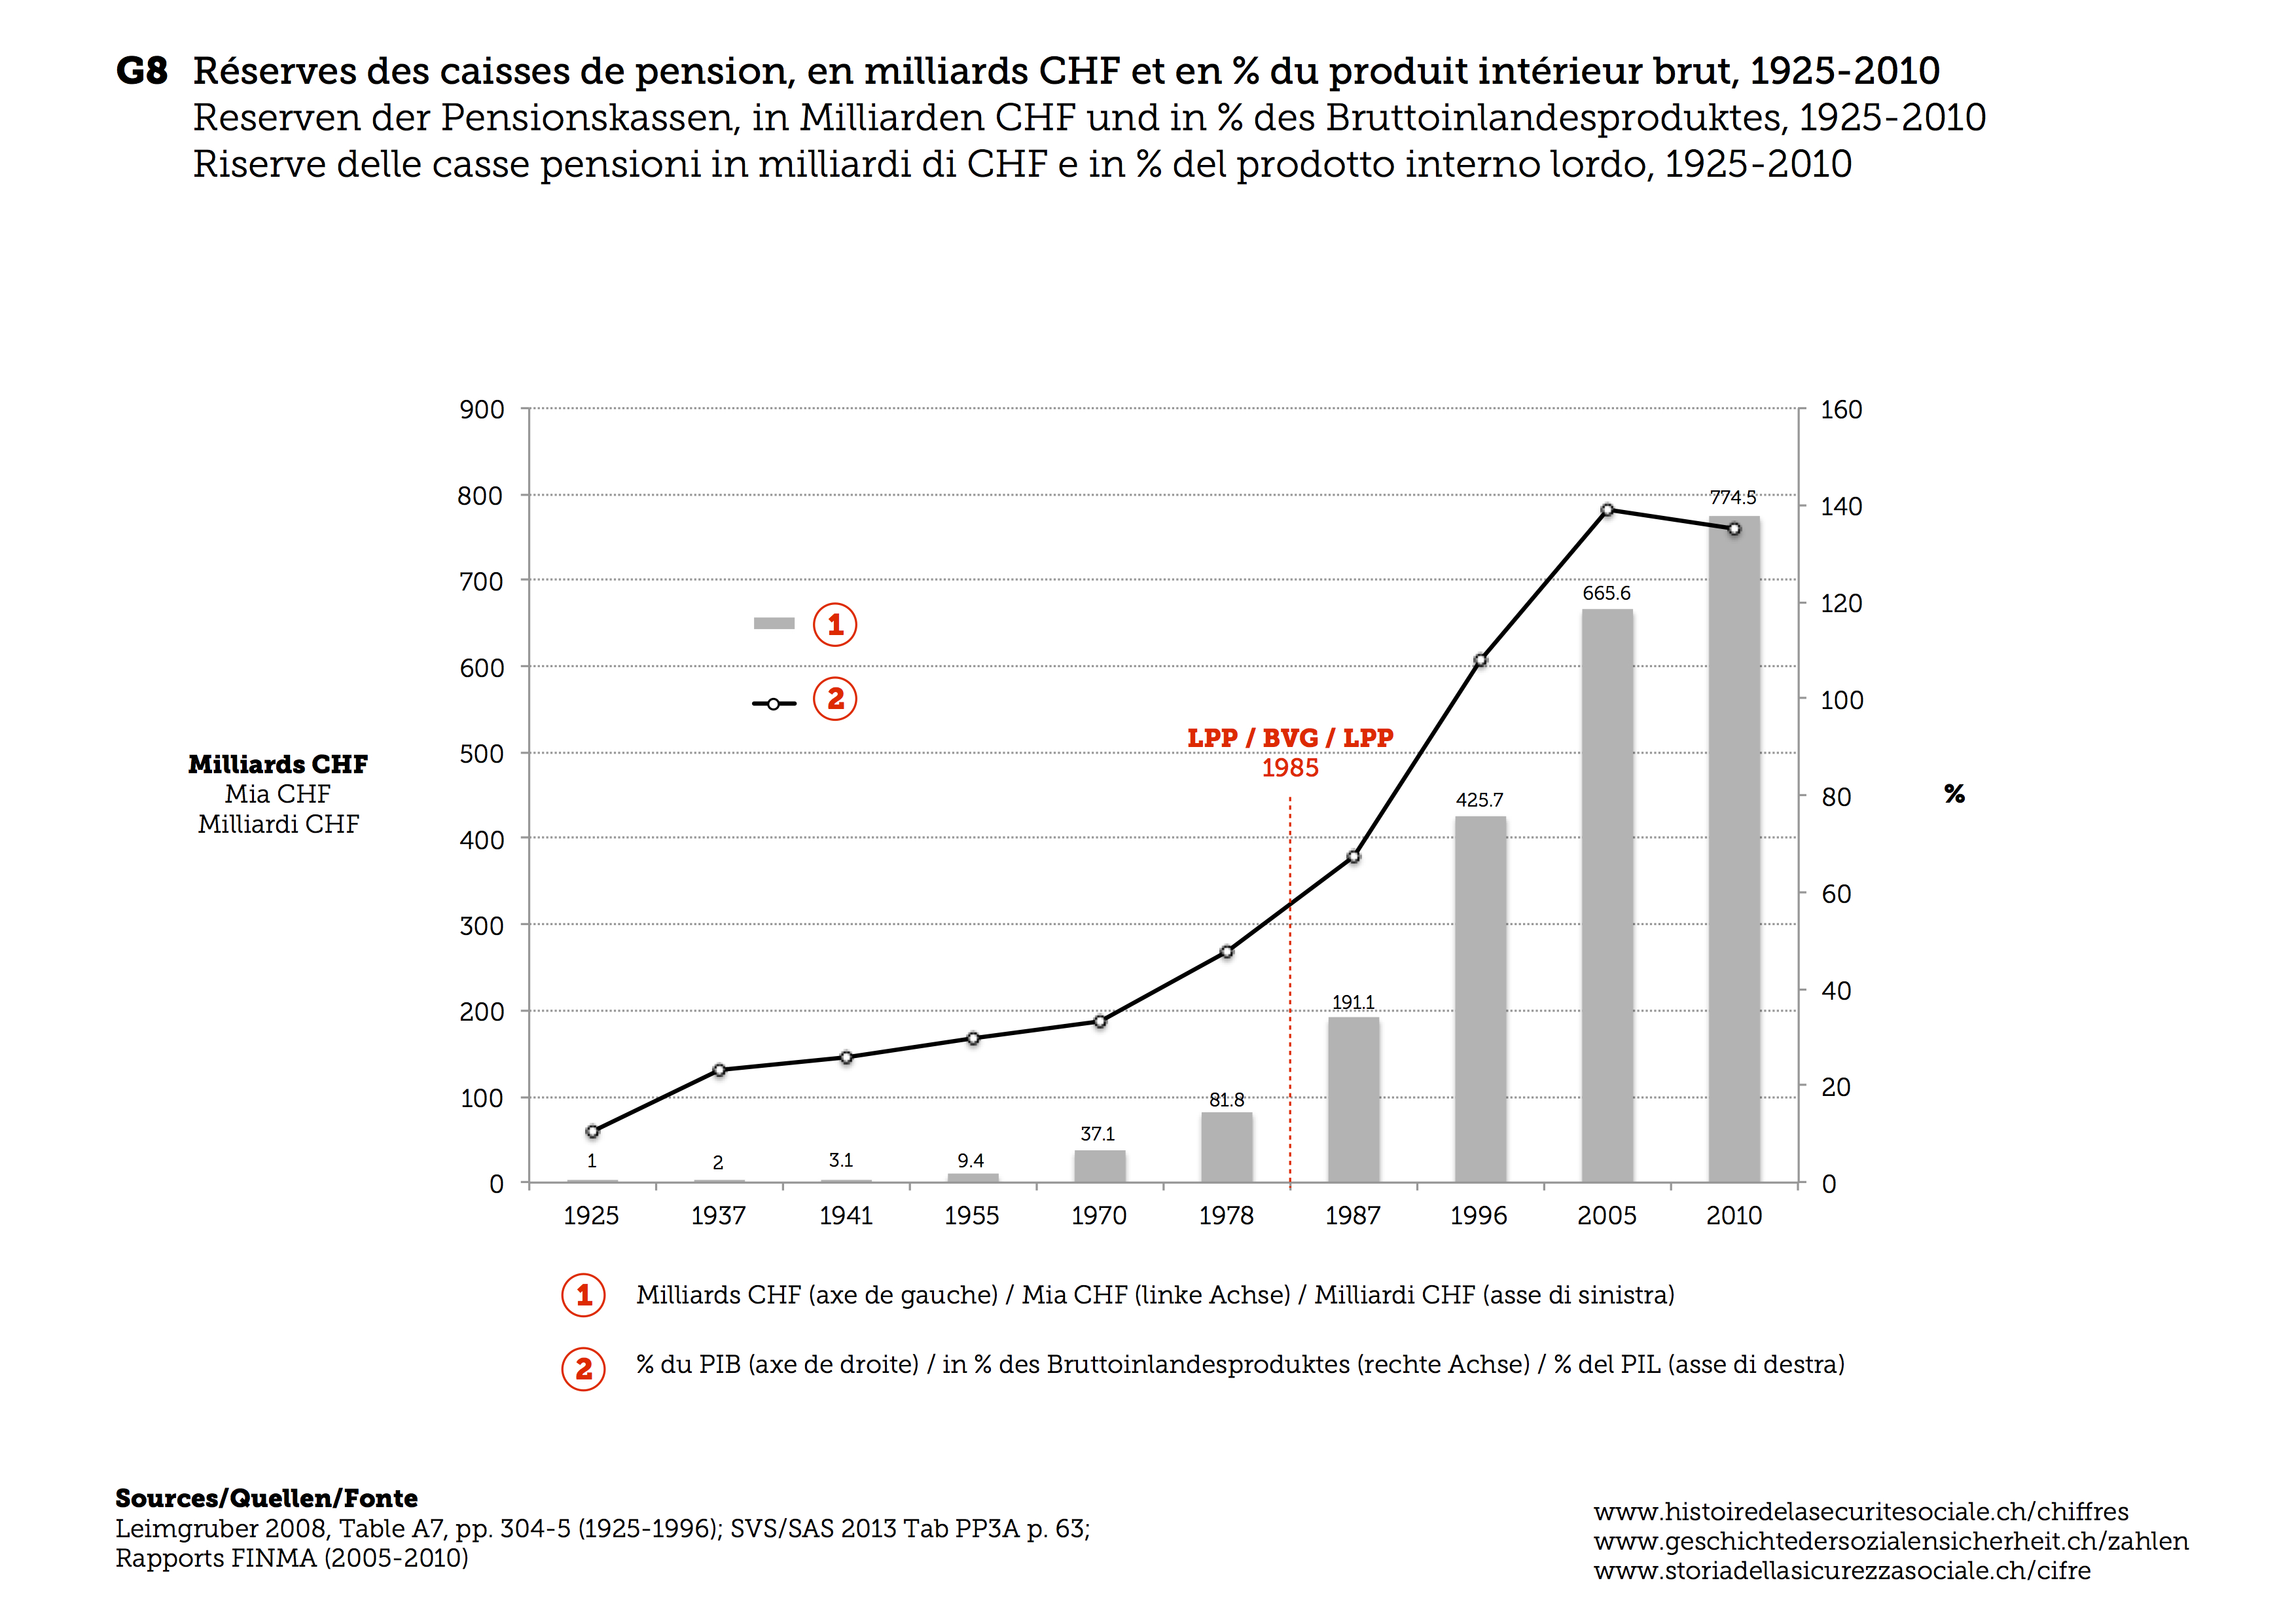
F8 Pension funds reserves in billion francs and as a percentage of gross domestic product, 1925-2010
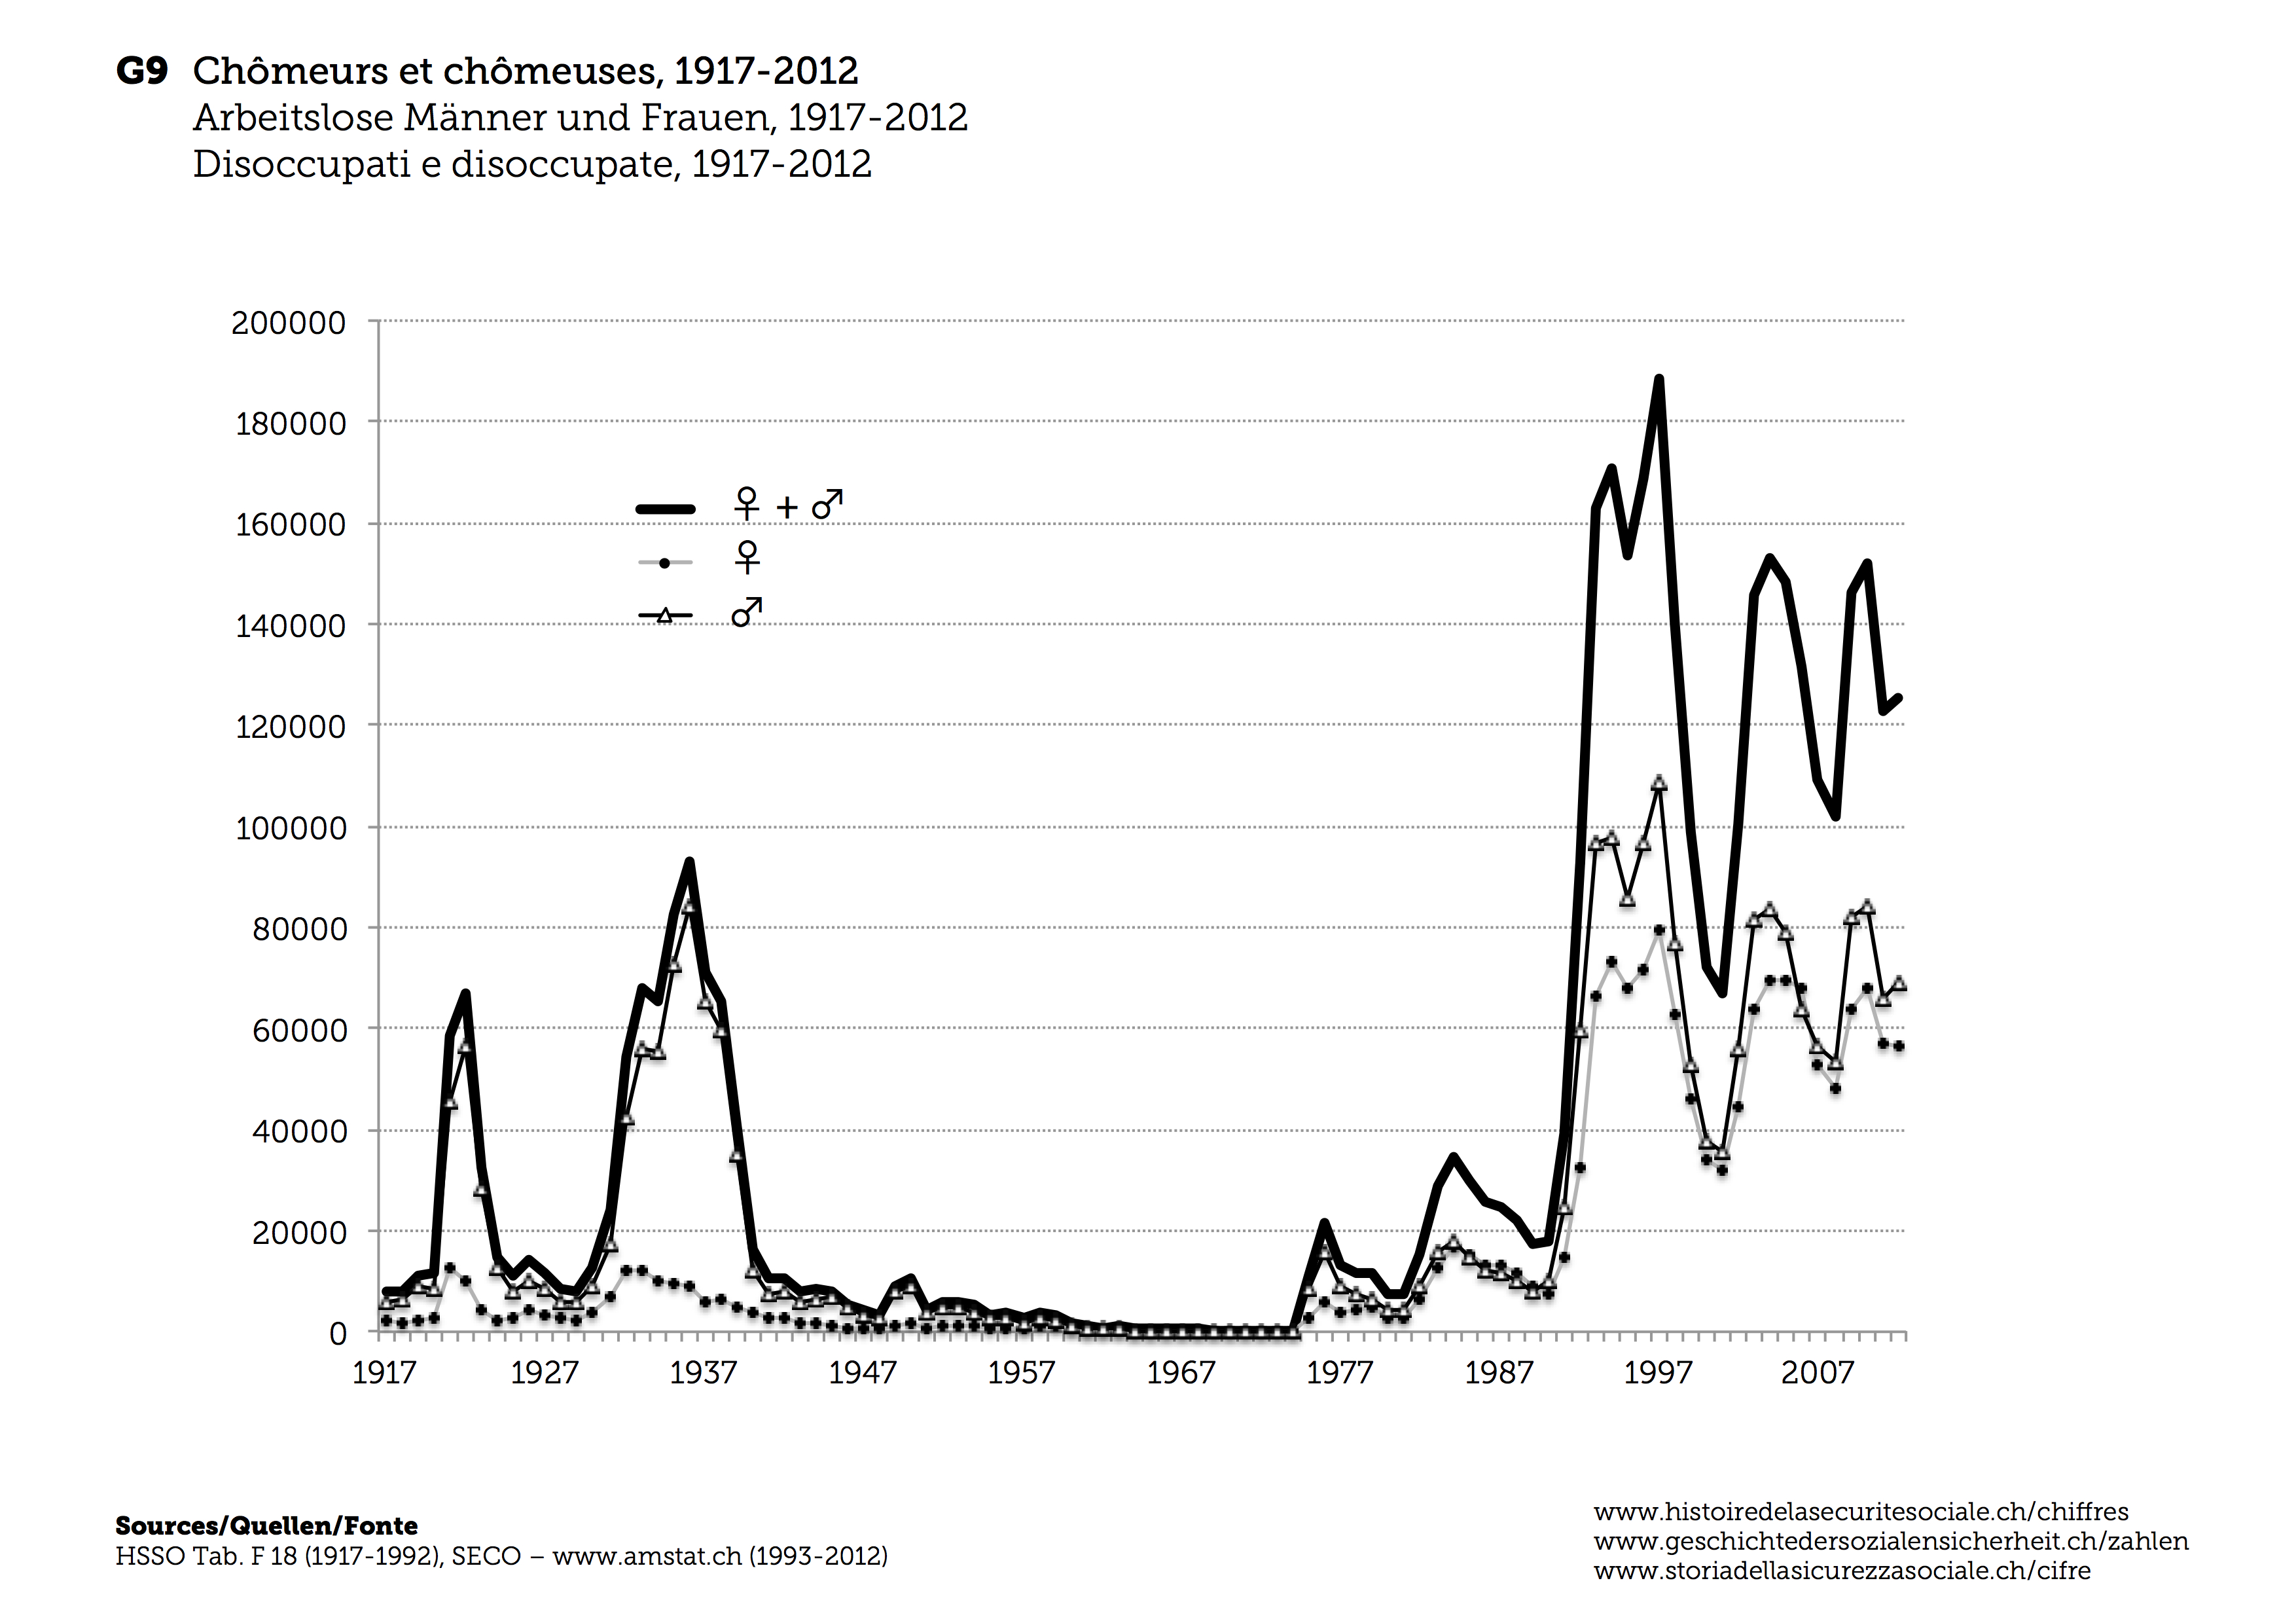
F9 Unemployed men and women, 1917-2012
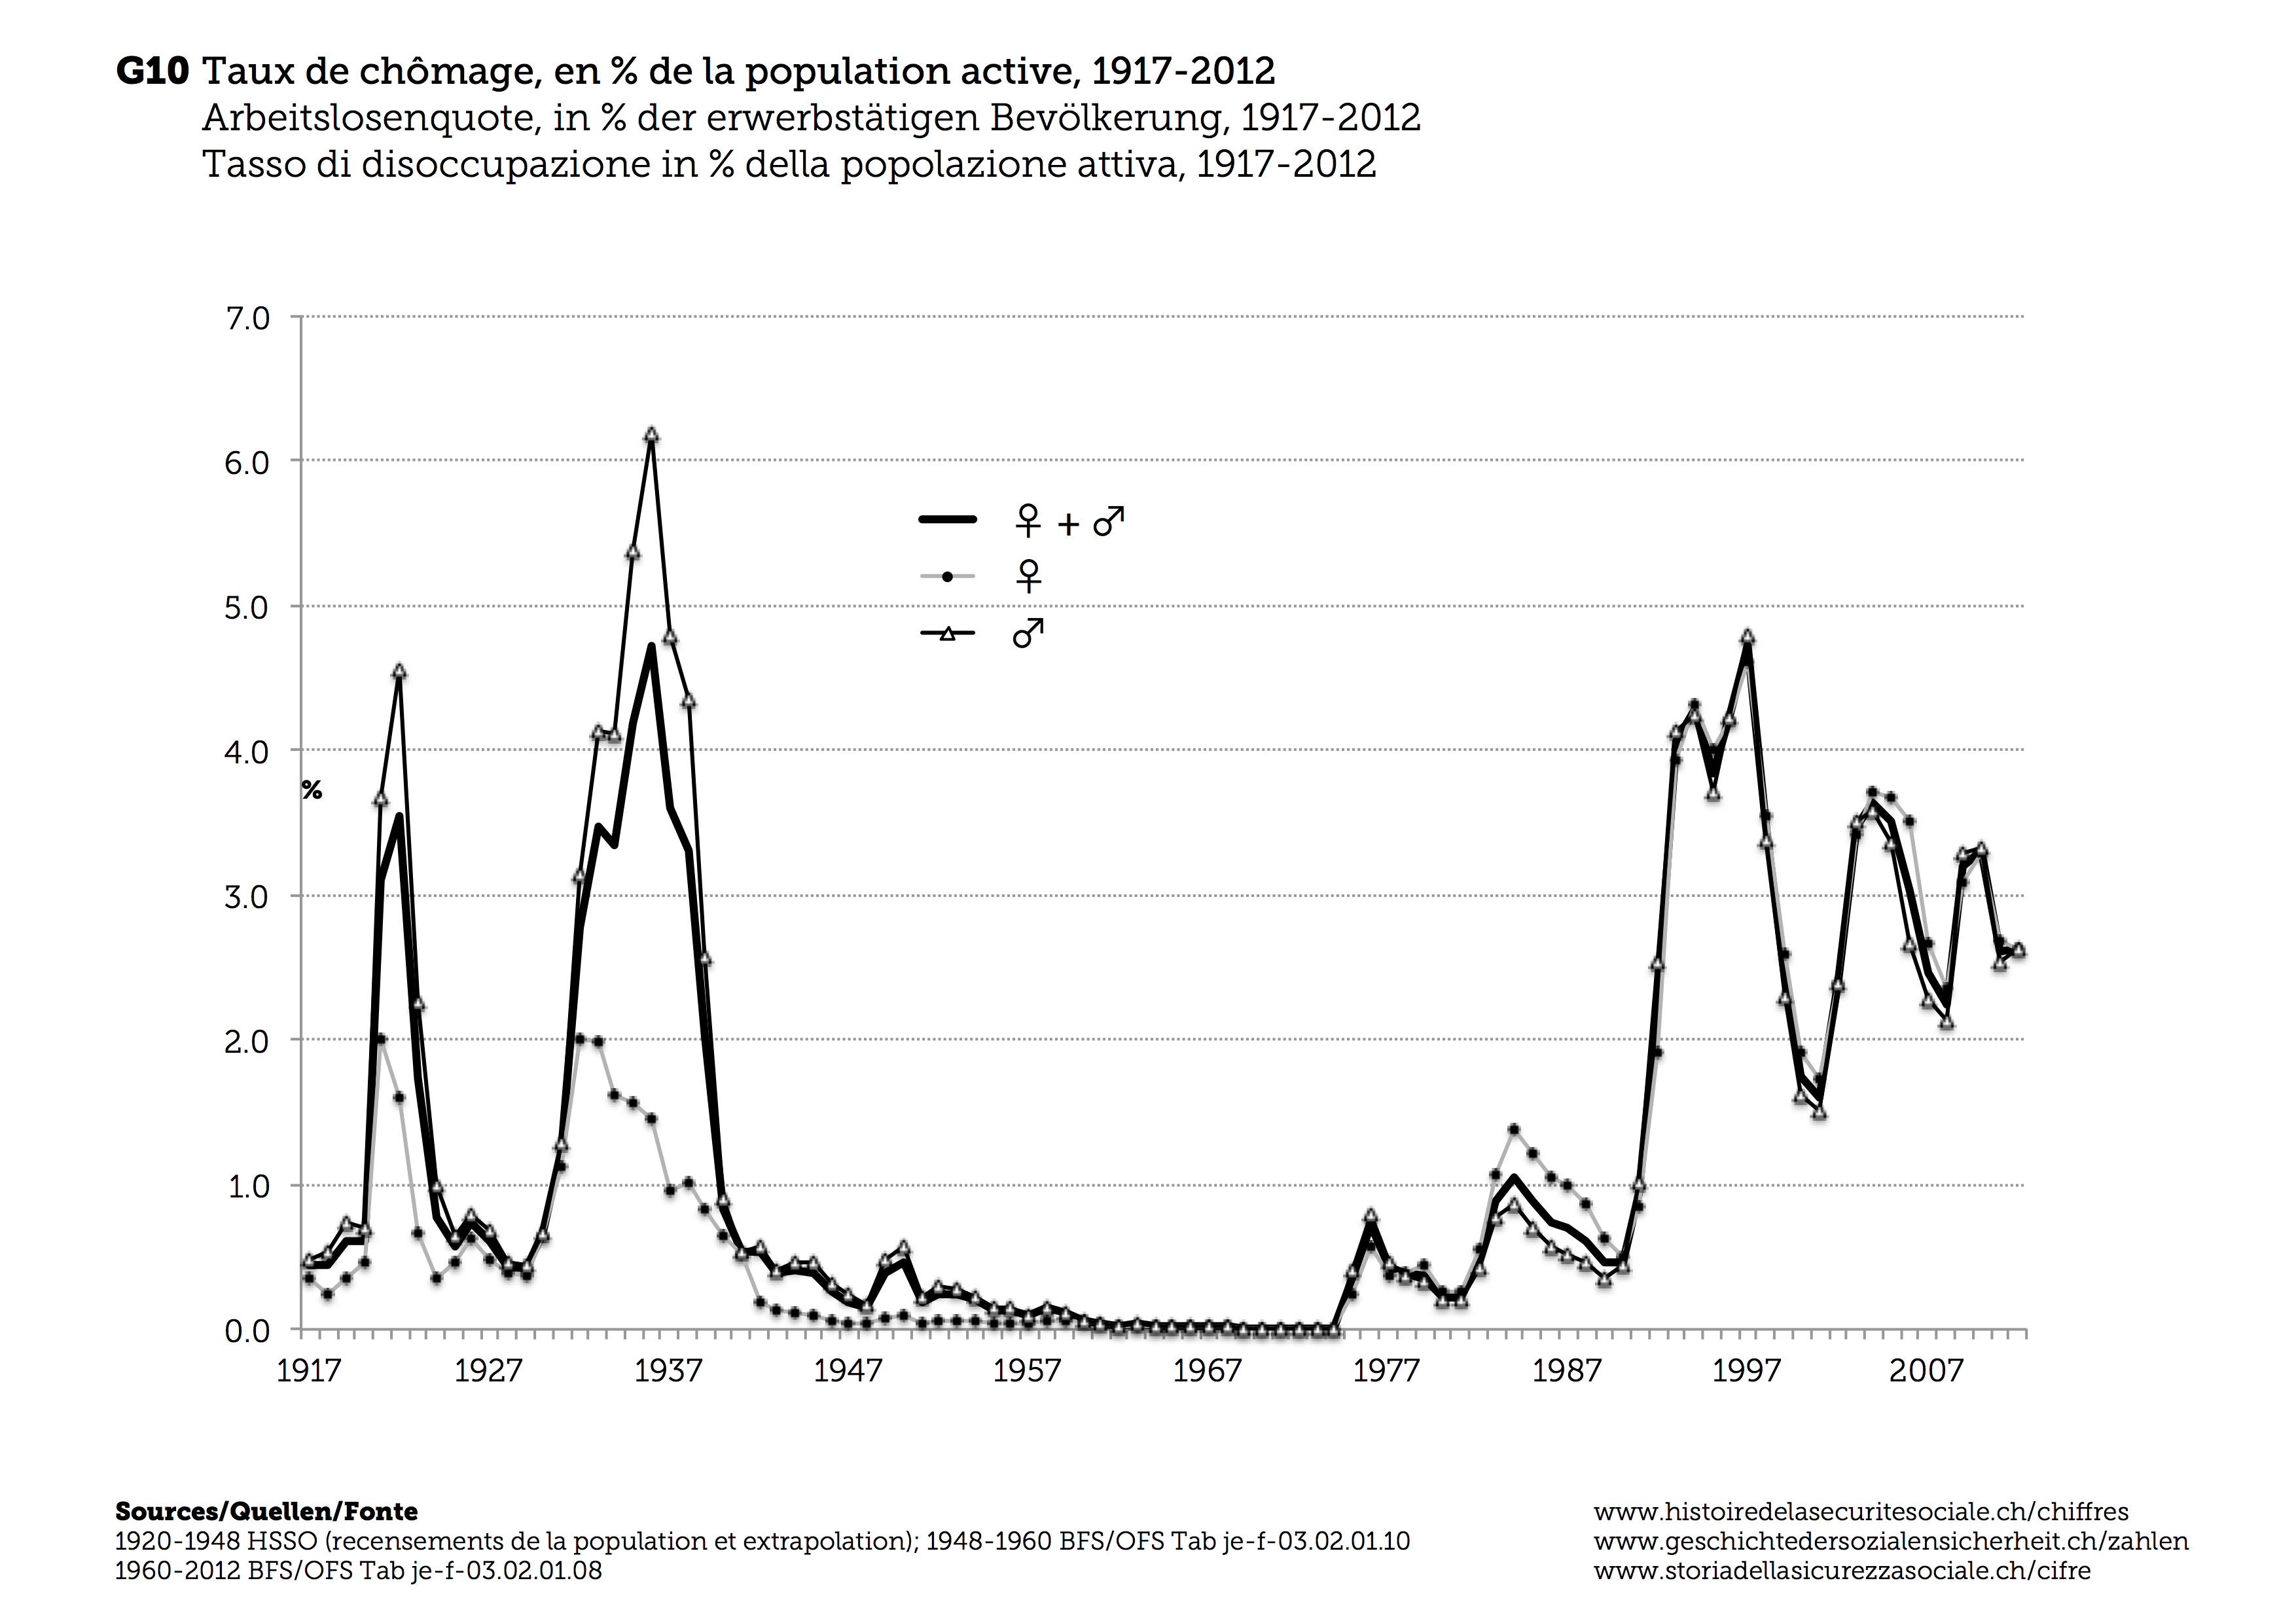
F10 Unemployment rate as a percentage of the working population, 1917-2012
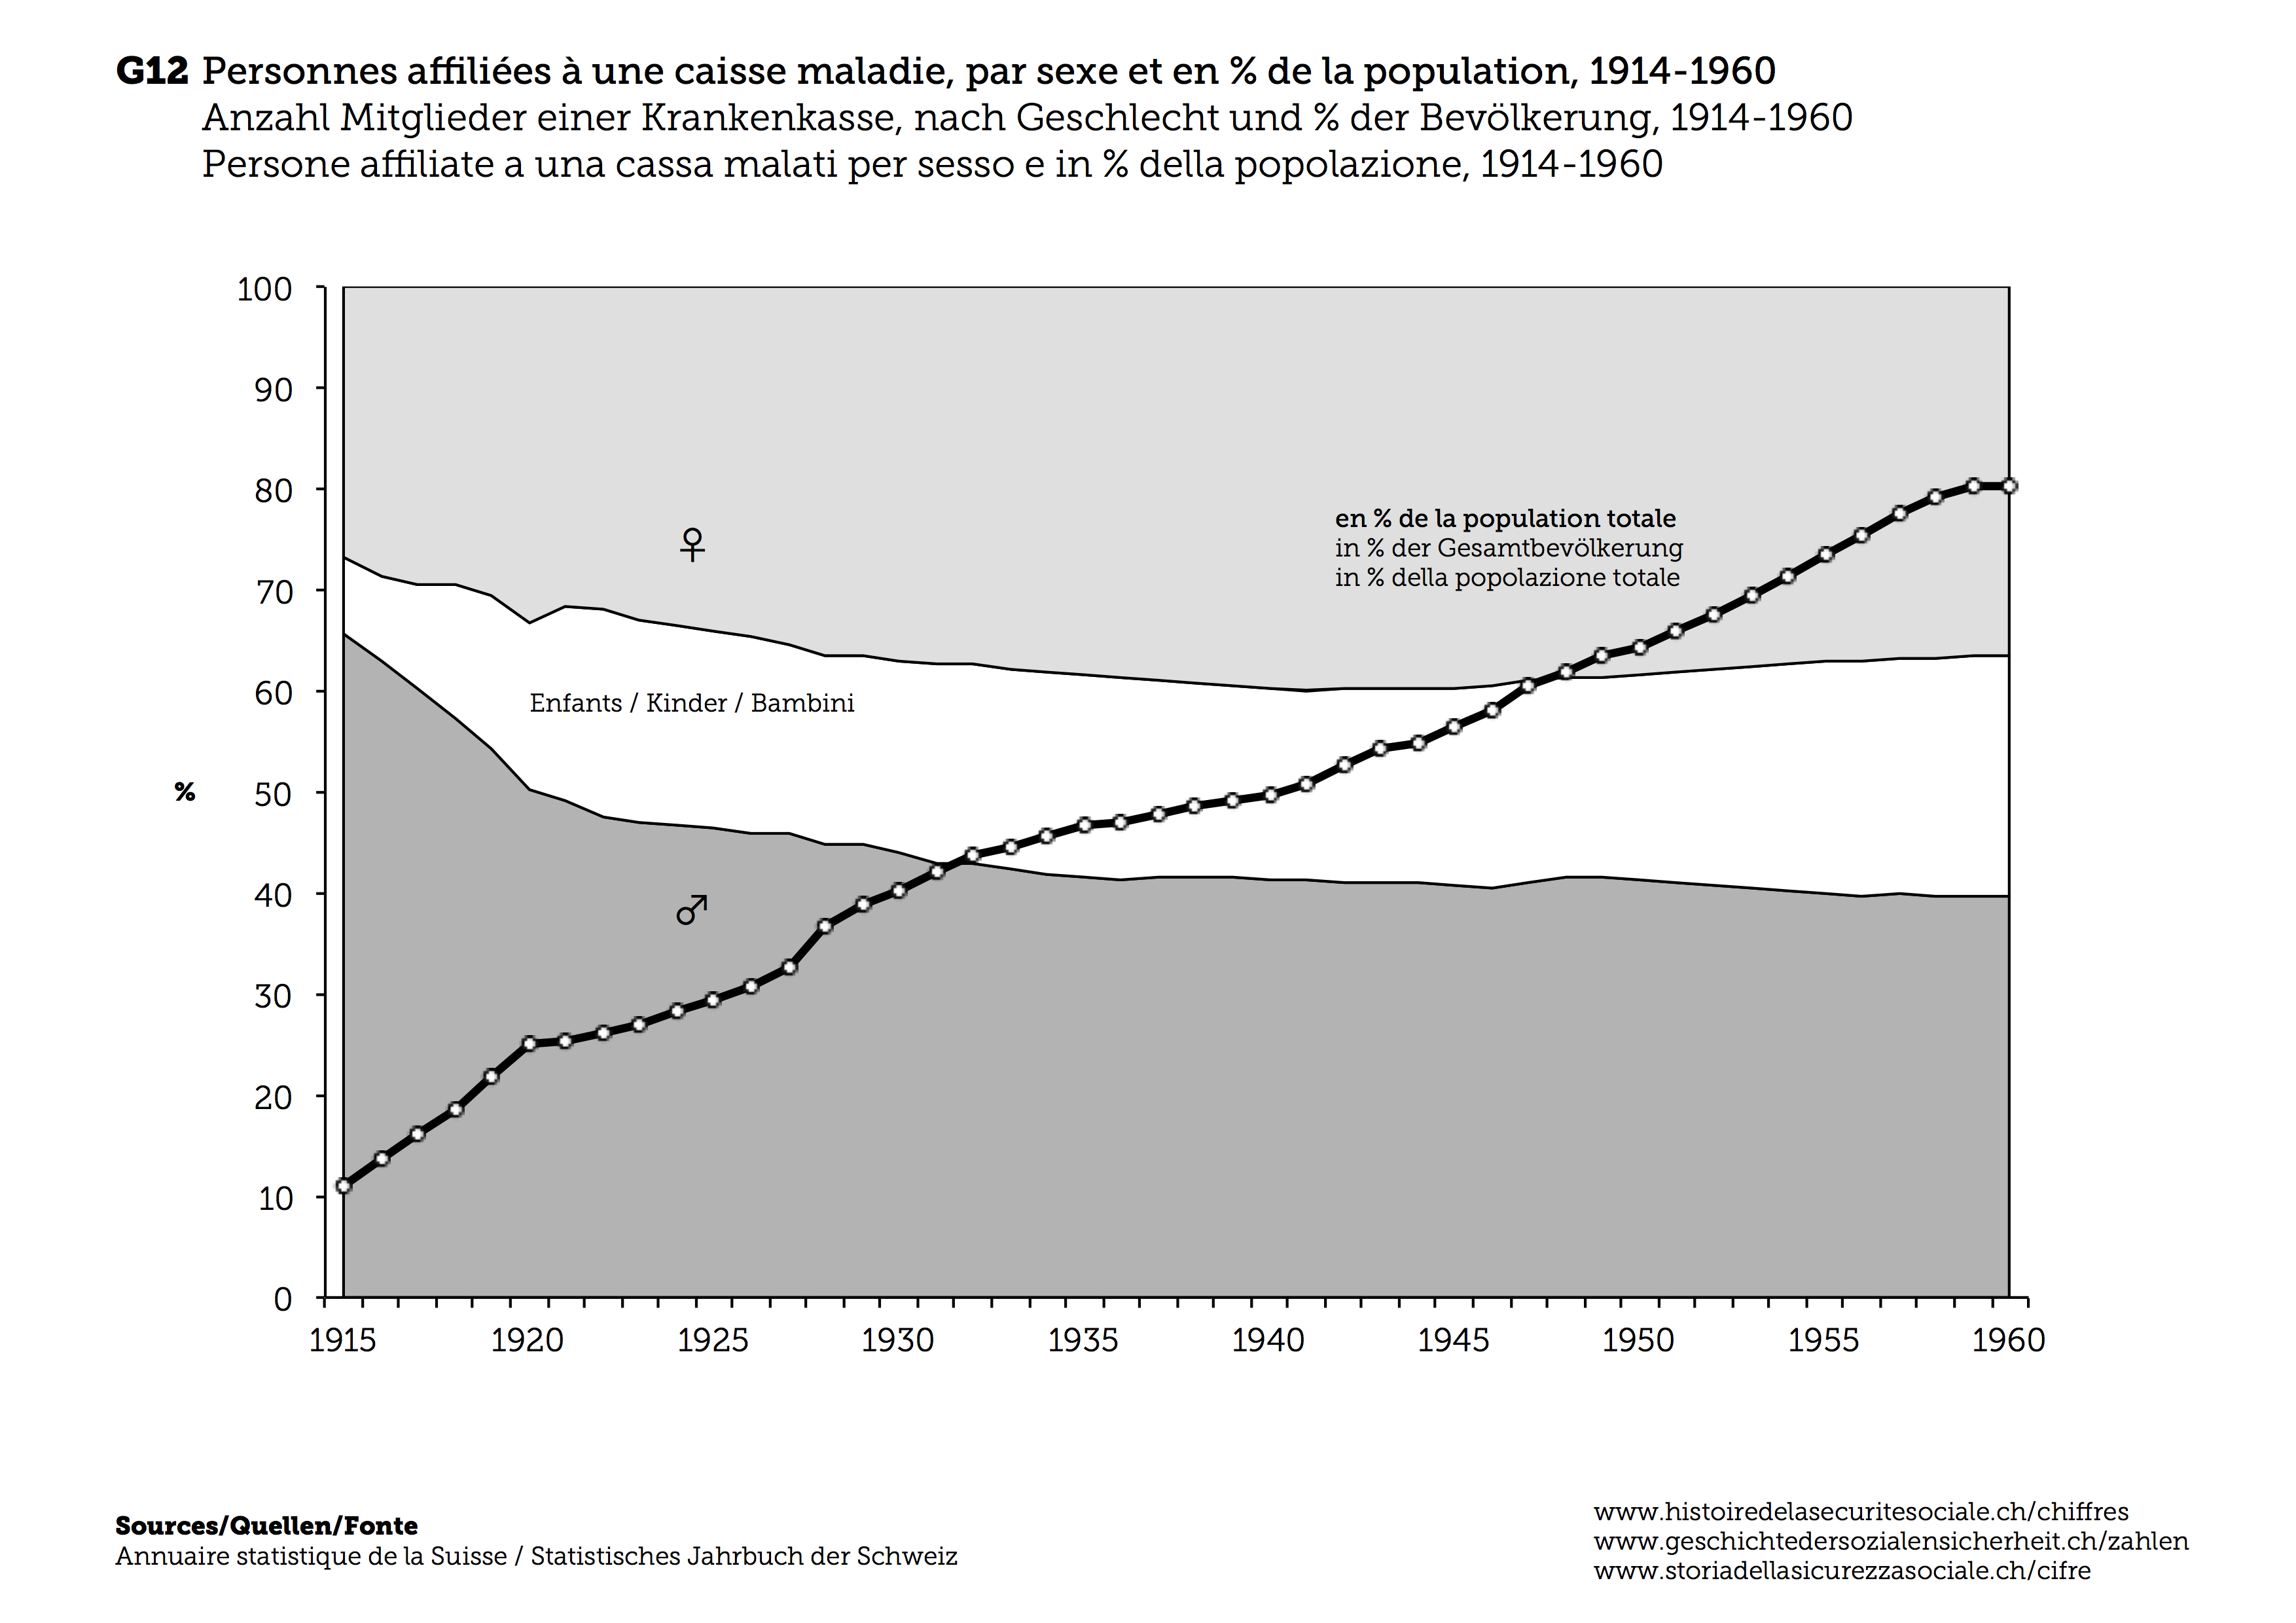
F12 Number of members of a health fund by sex and as a percentage of the population, 1914-1960
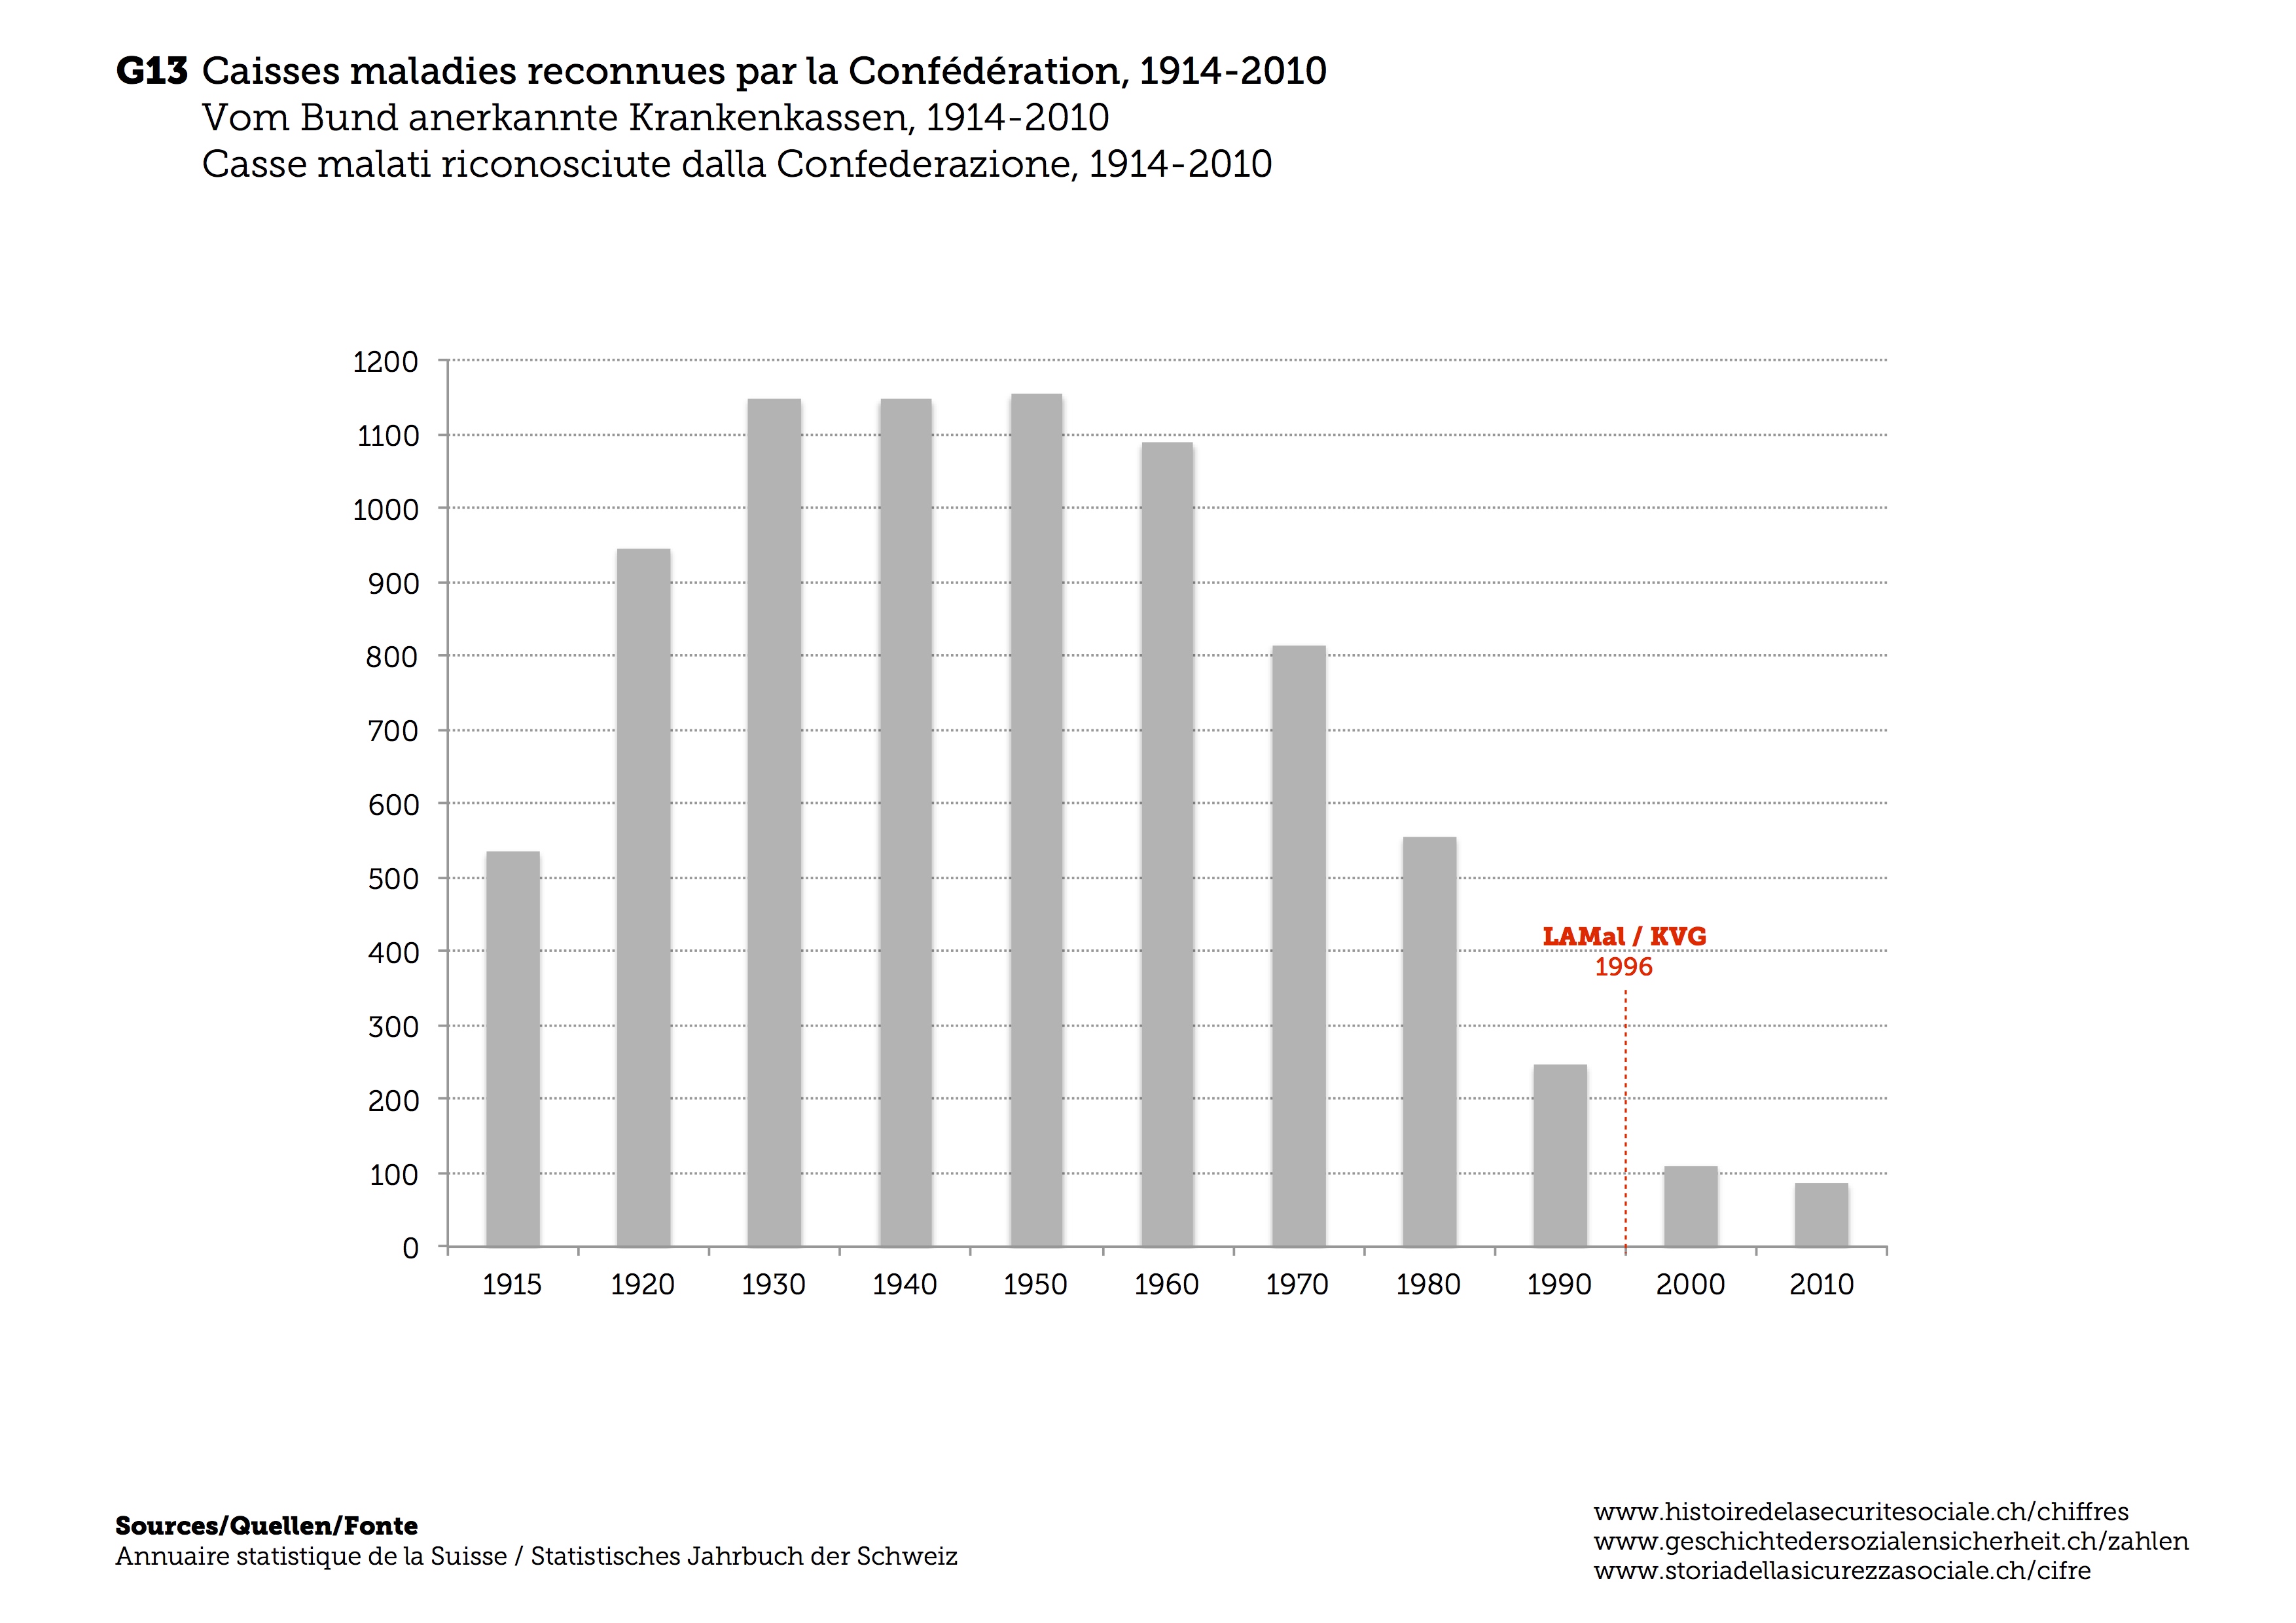
F13 Federally approved health funds, 1914-2010
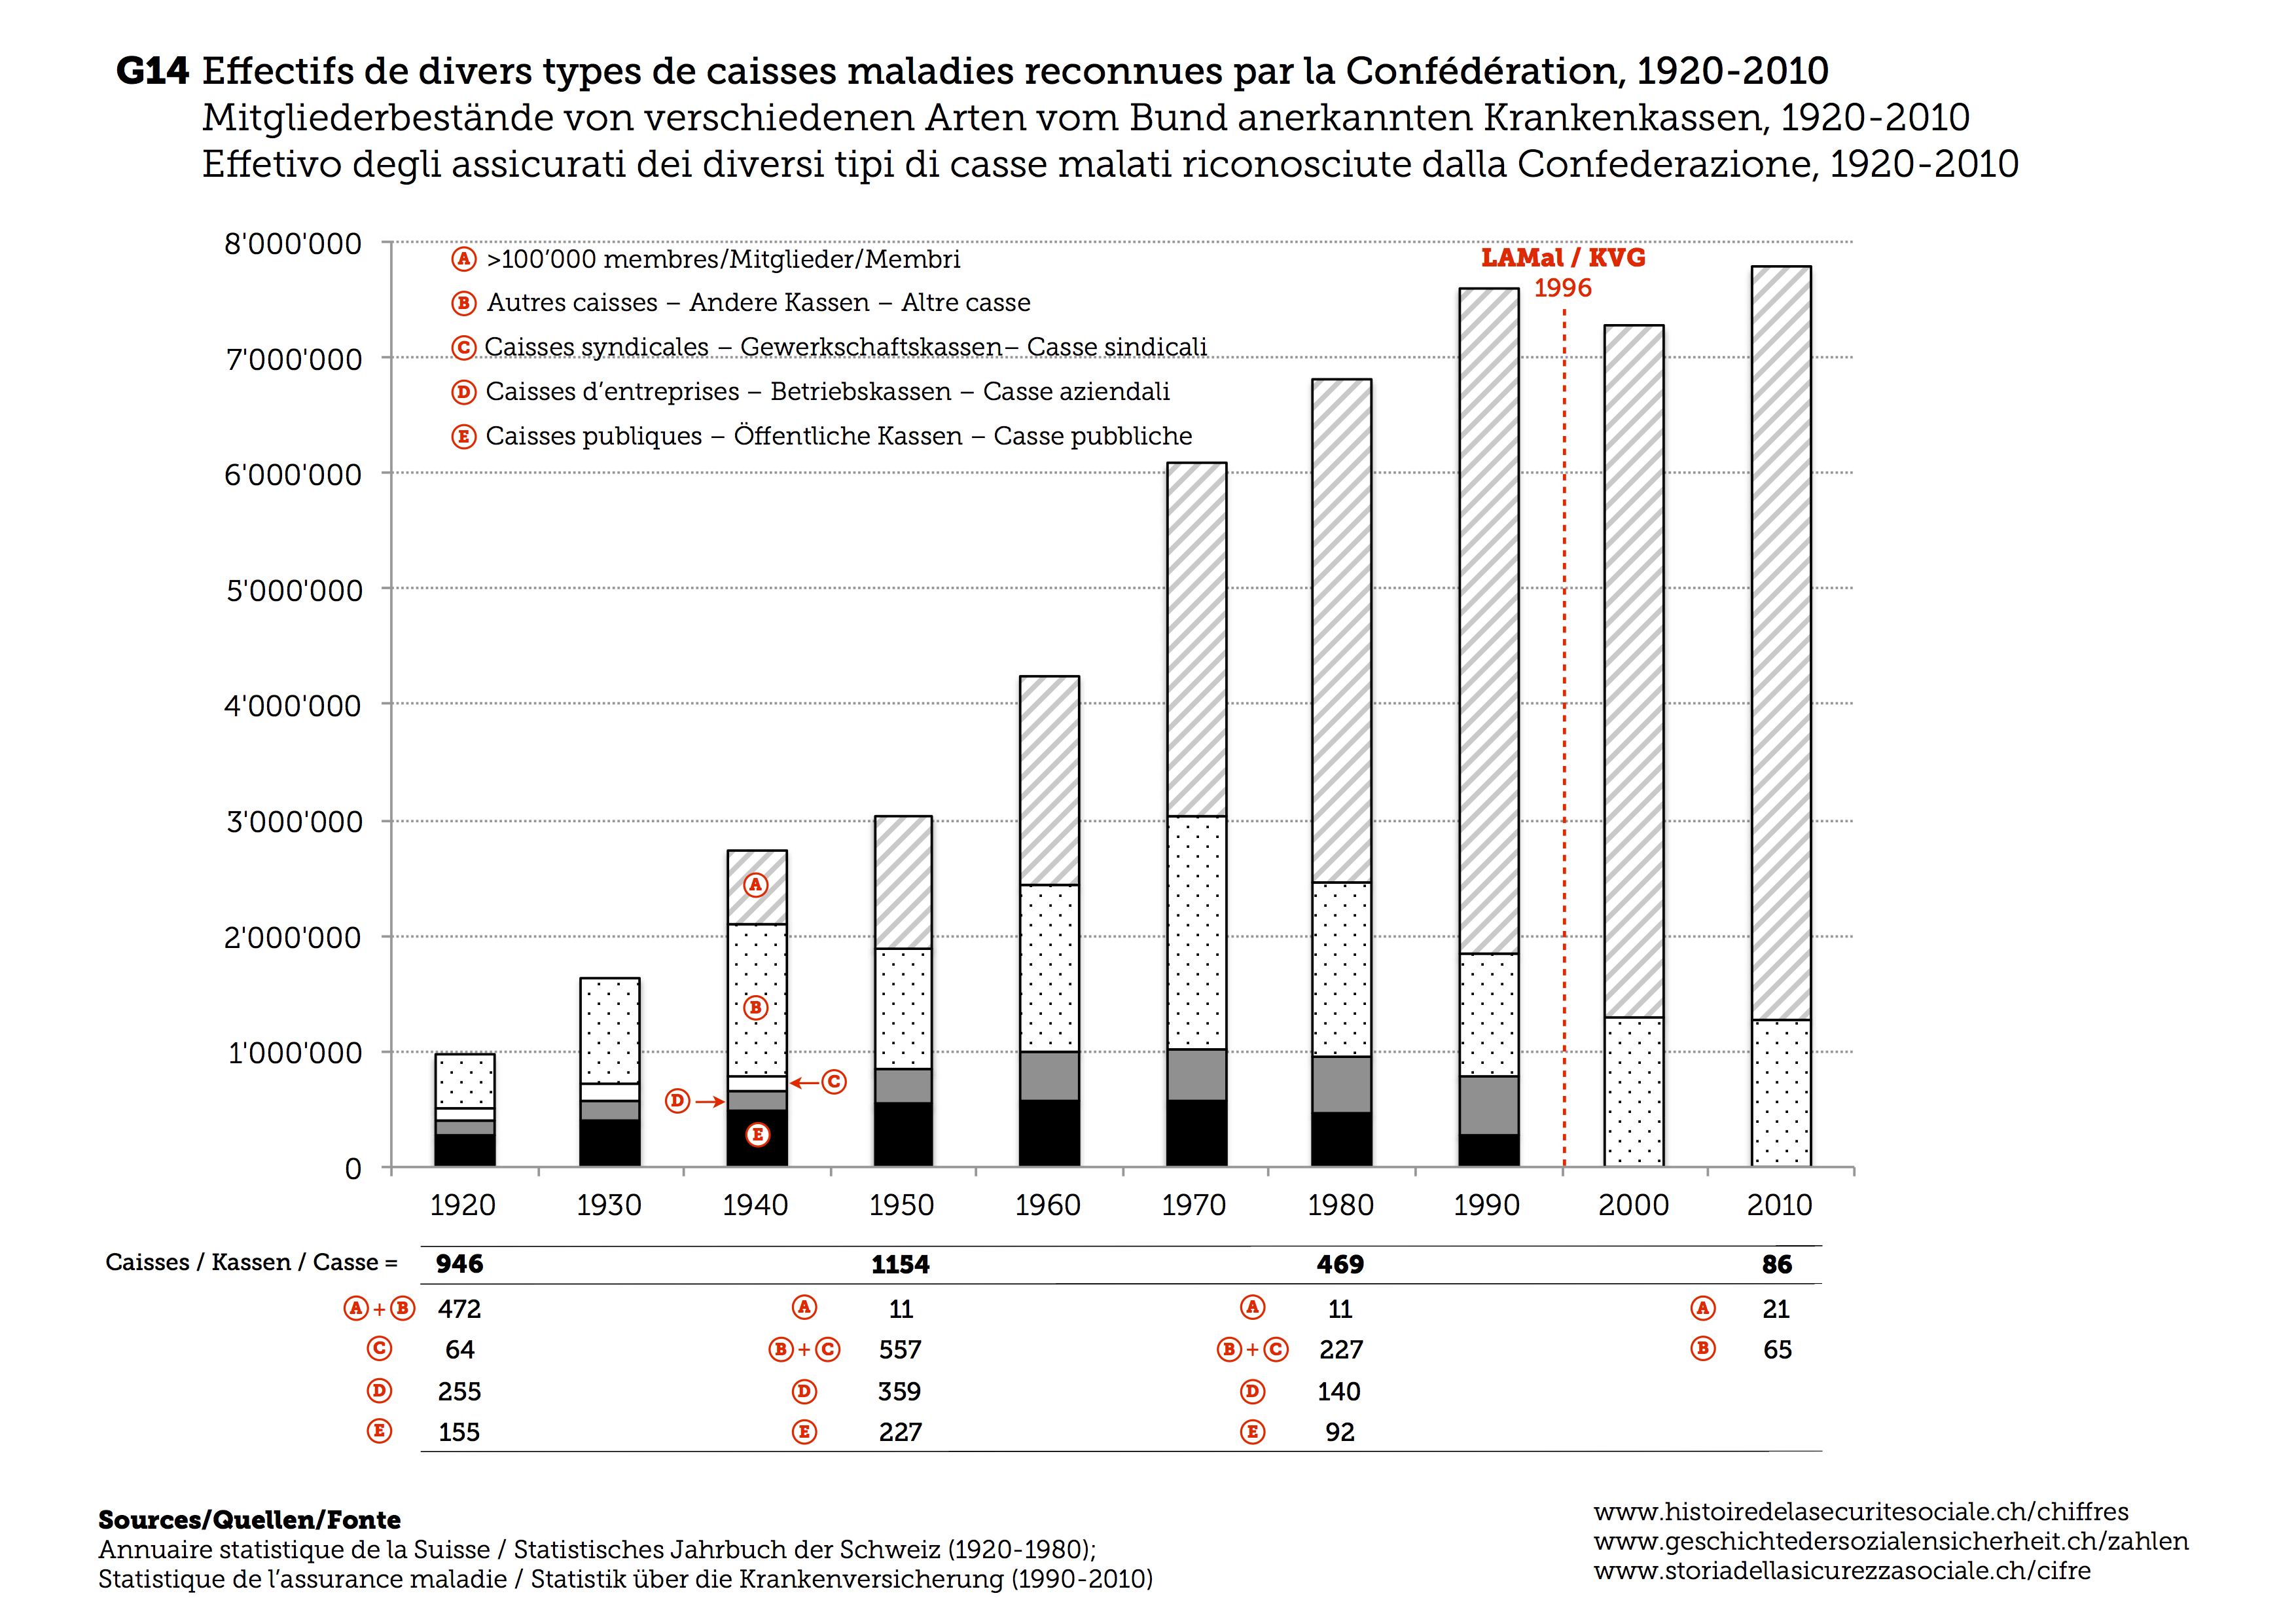
F14 Memberships of various types of federally approved health funds, 1920-2010
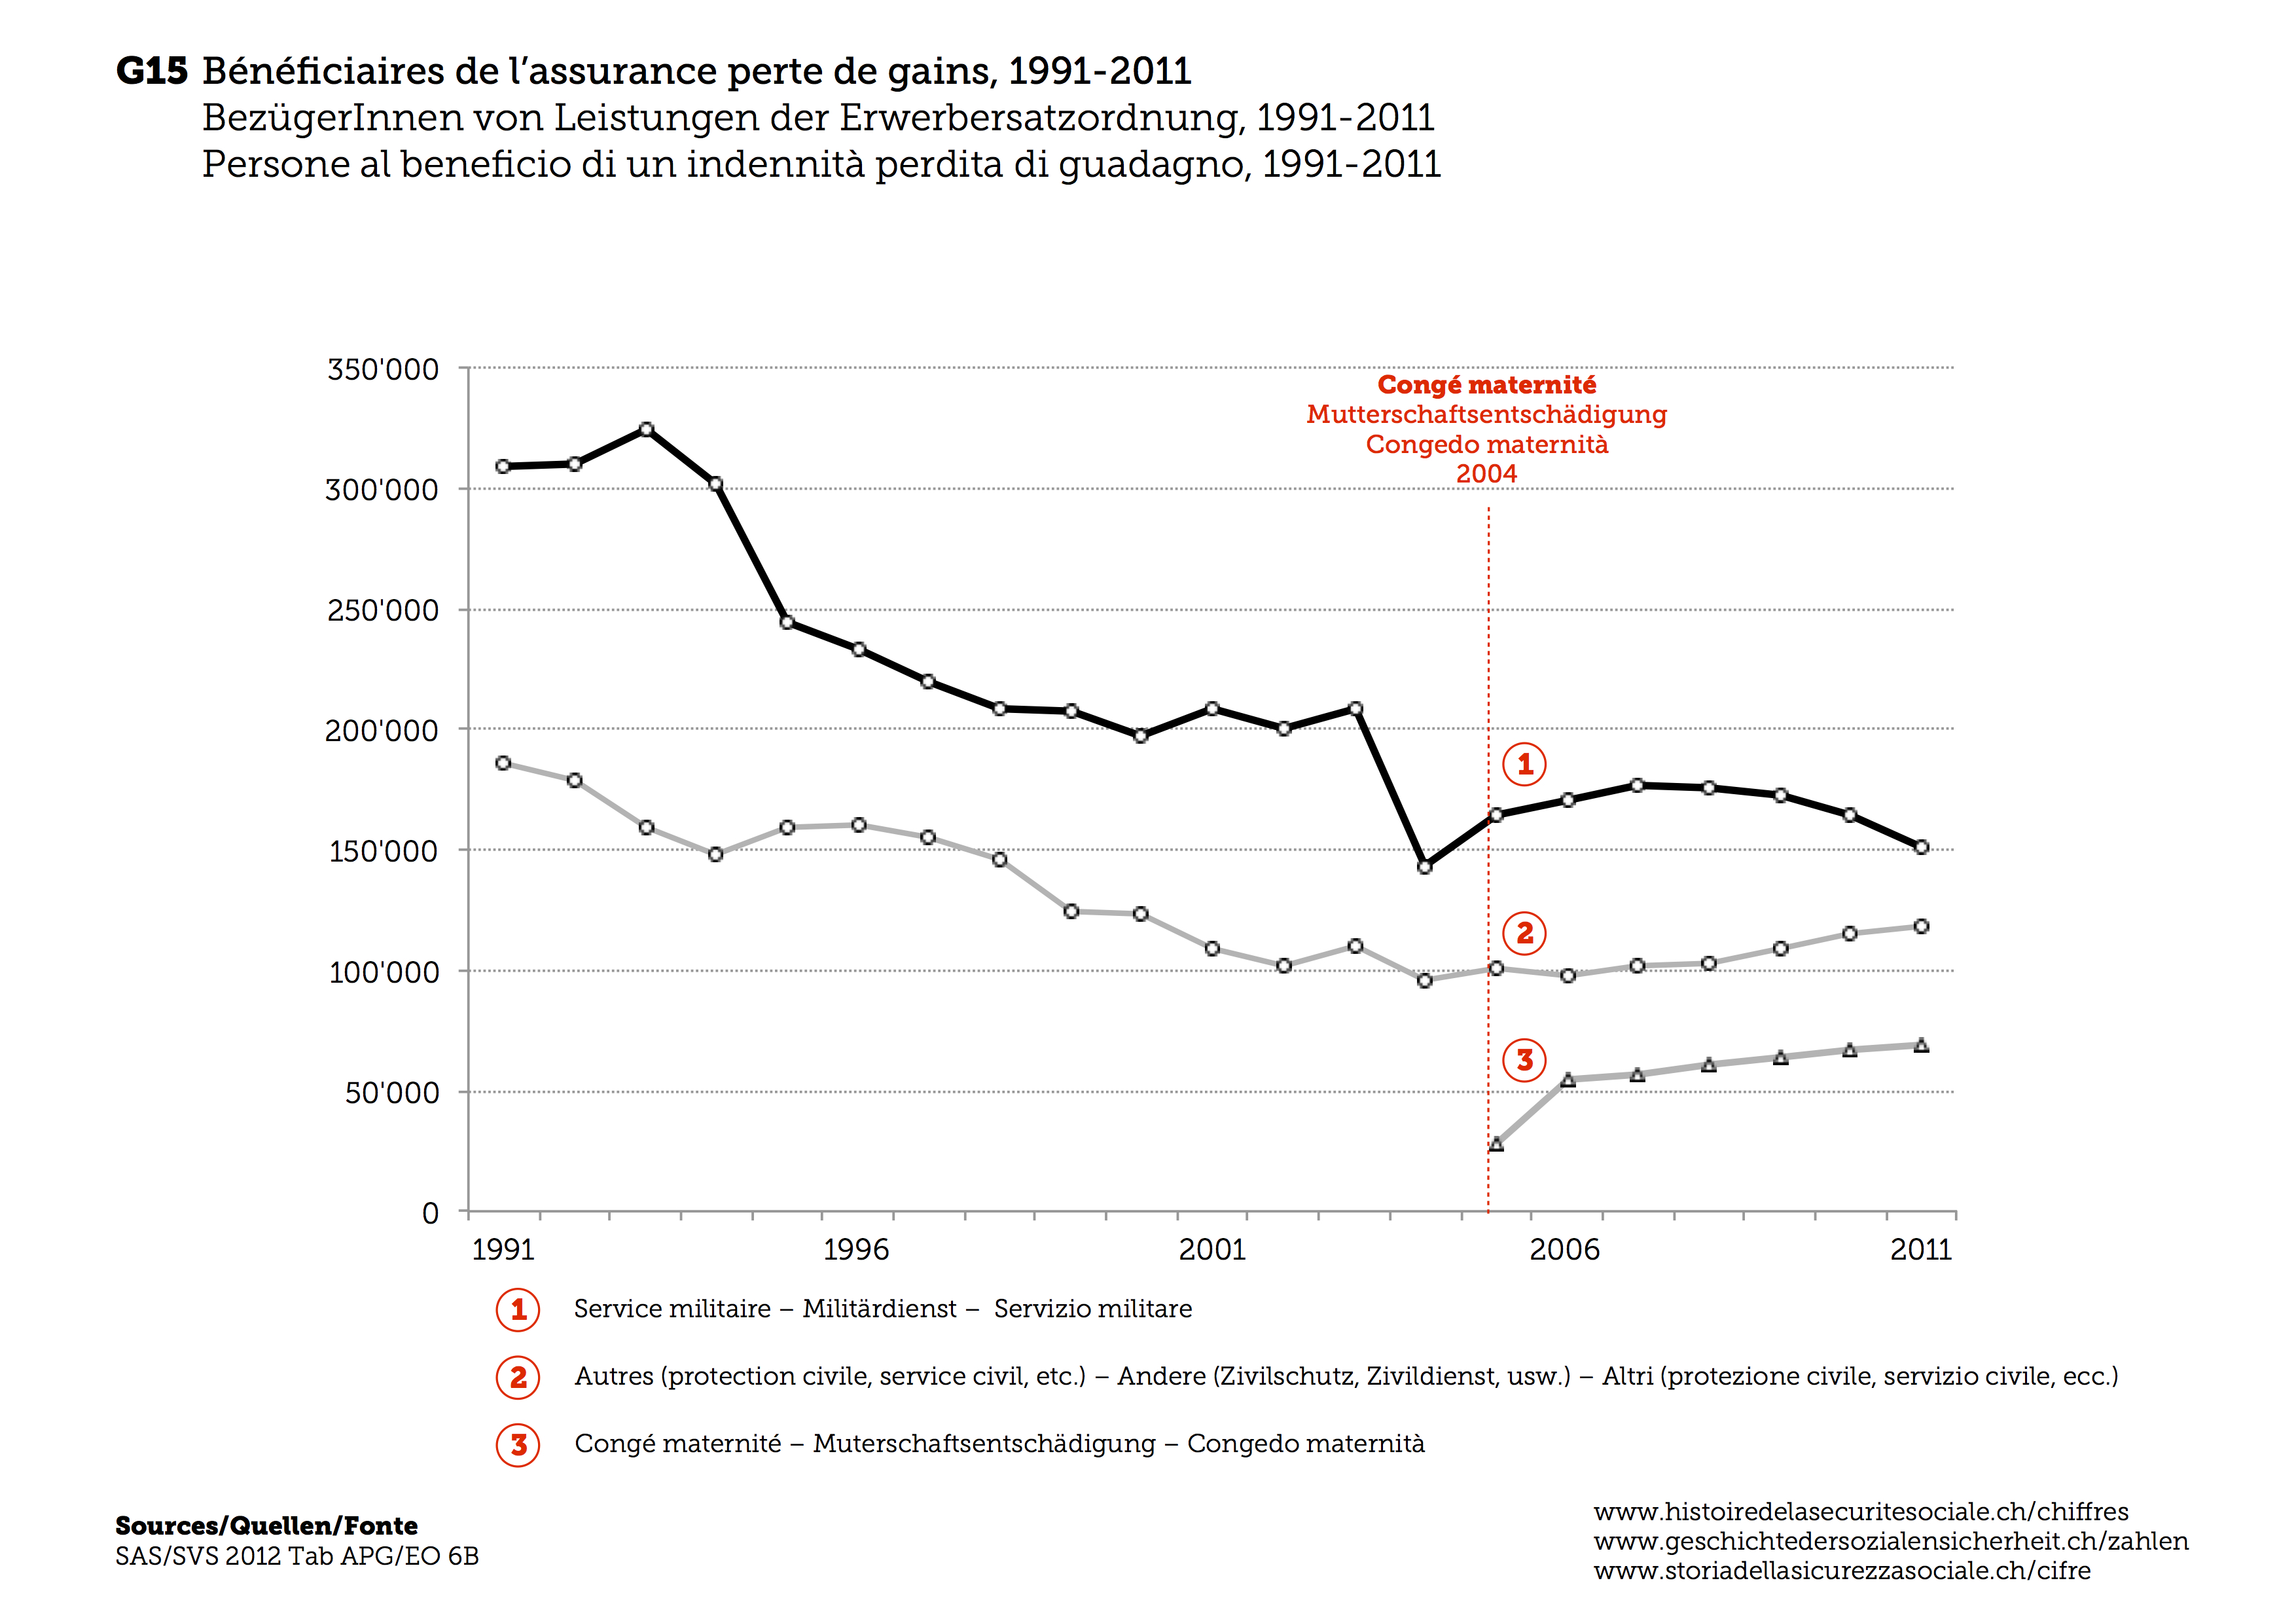
F15 Recipients of income substitution insurance (EO) benefits, 1991-2011
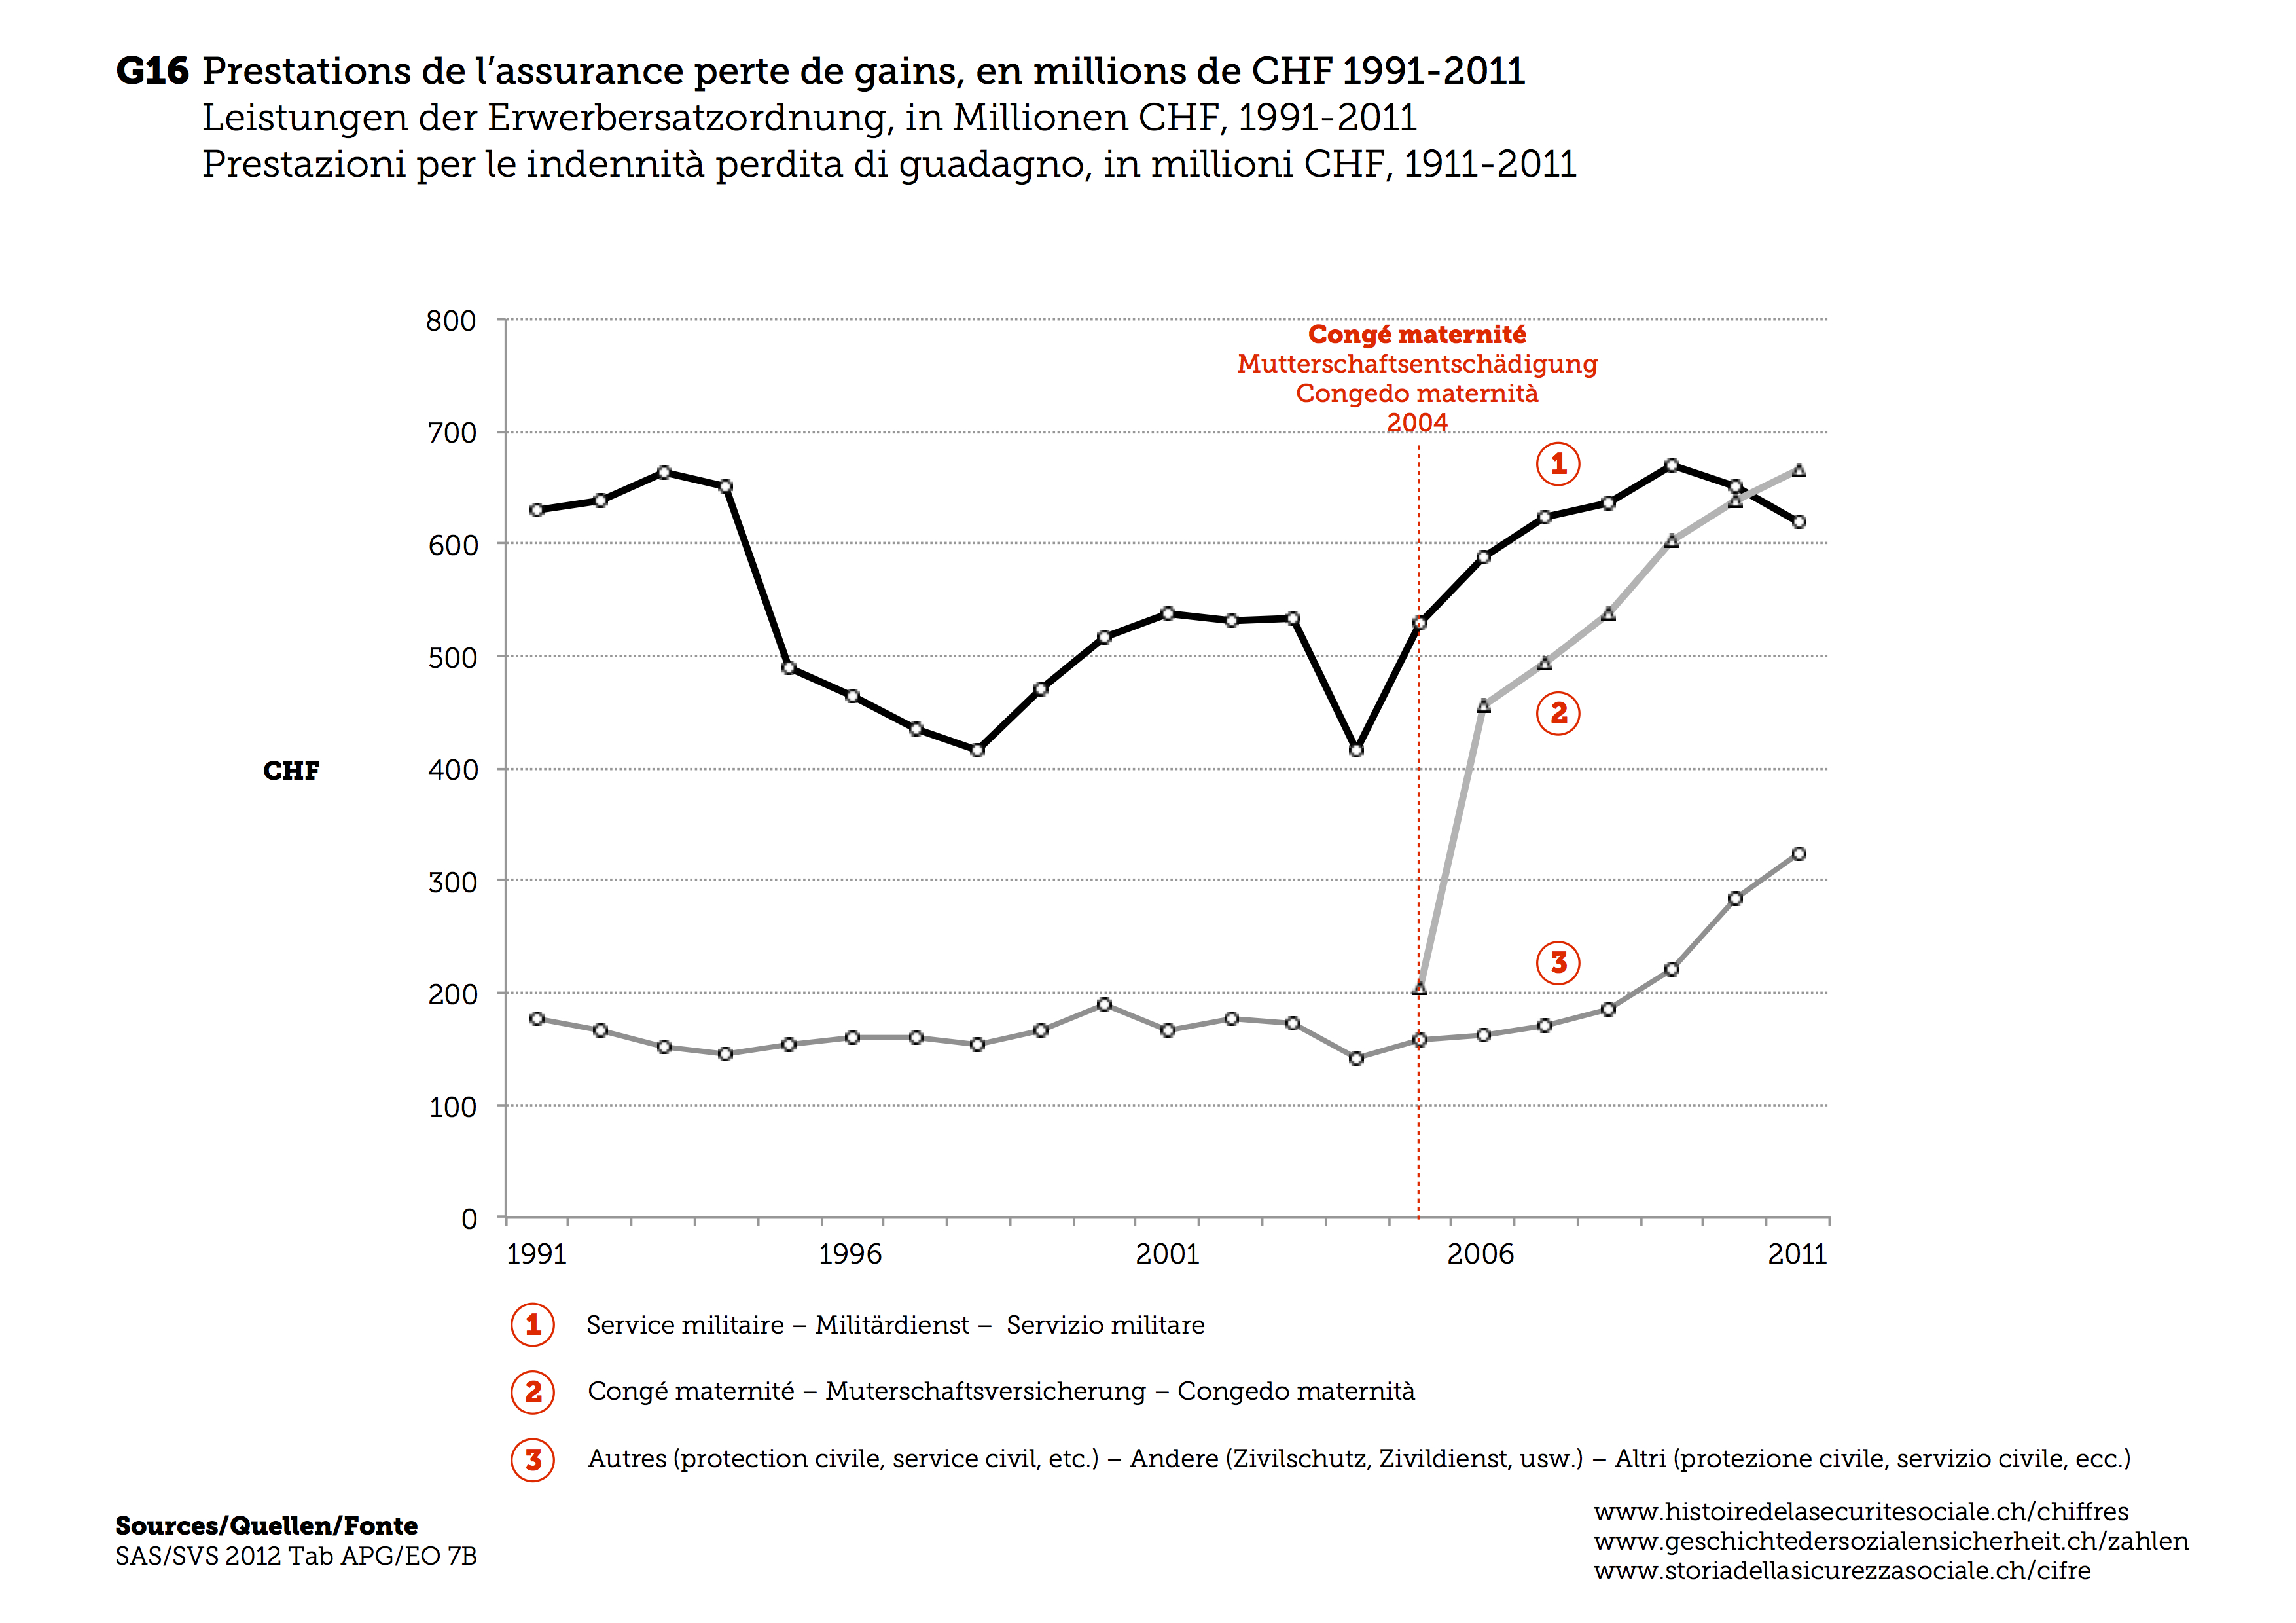
F16 Income substitution insurance (EO) benefits in million francs, 1991-2011
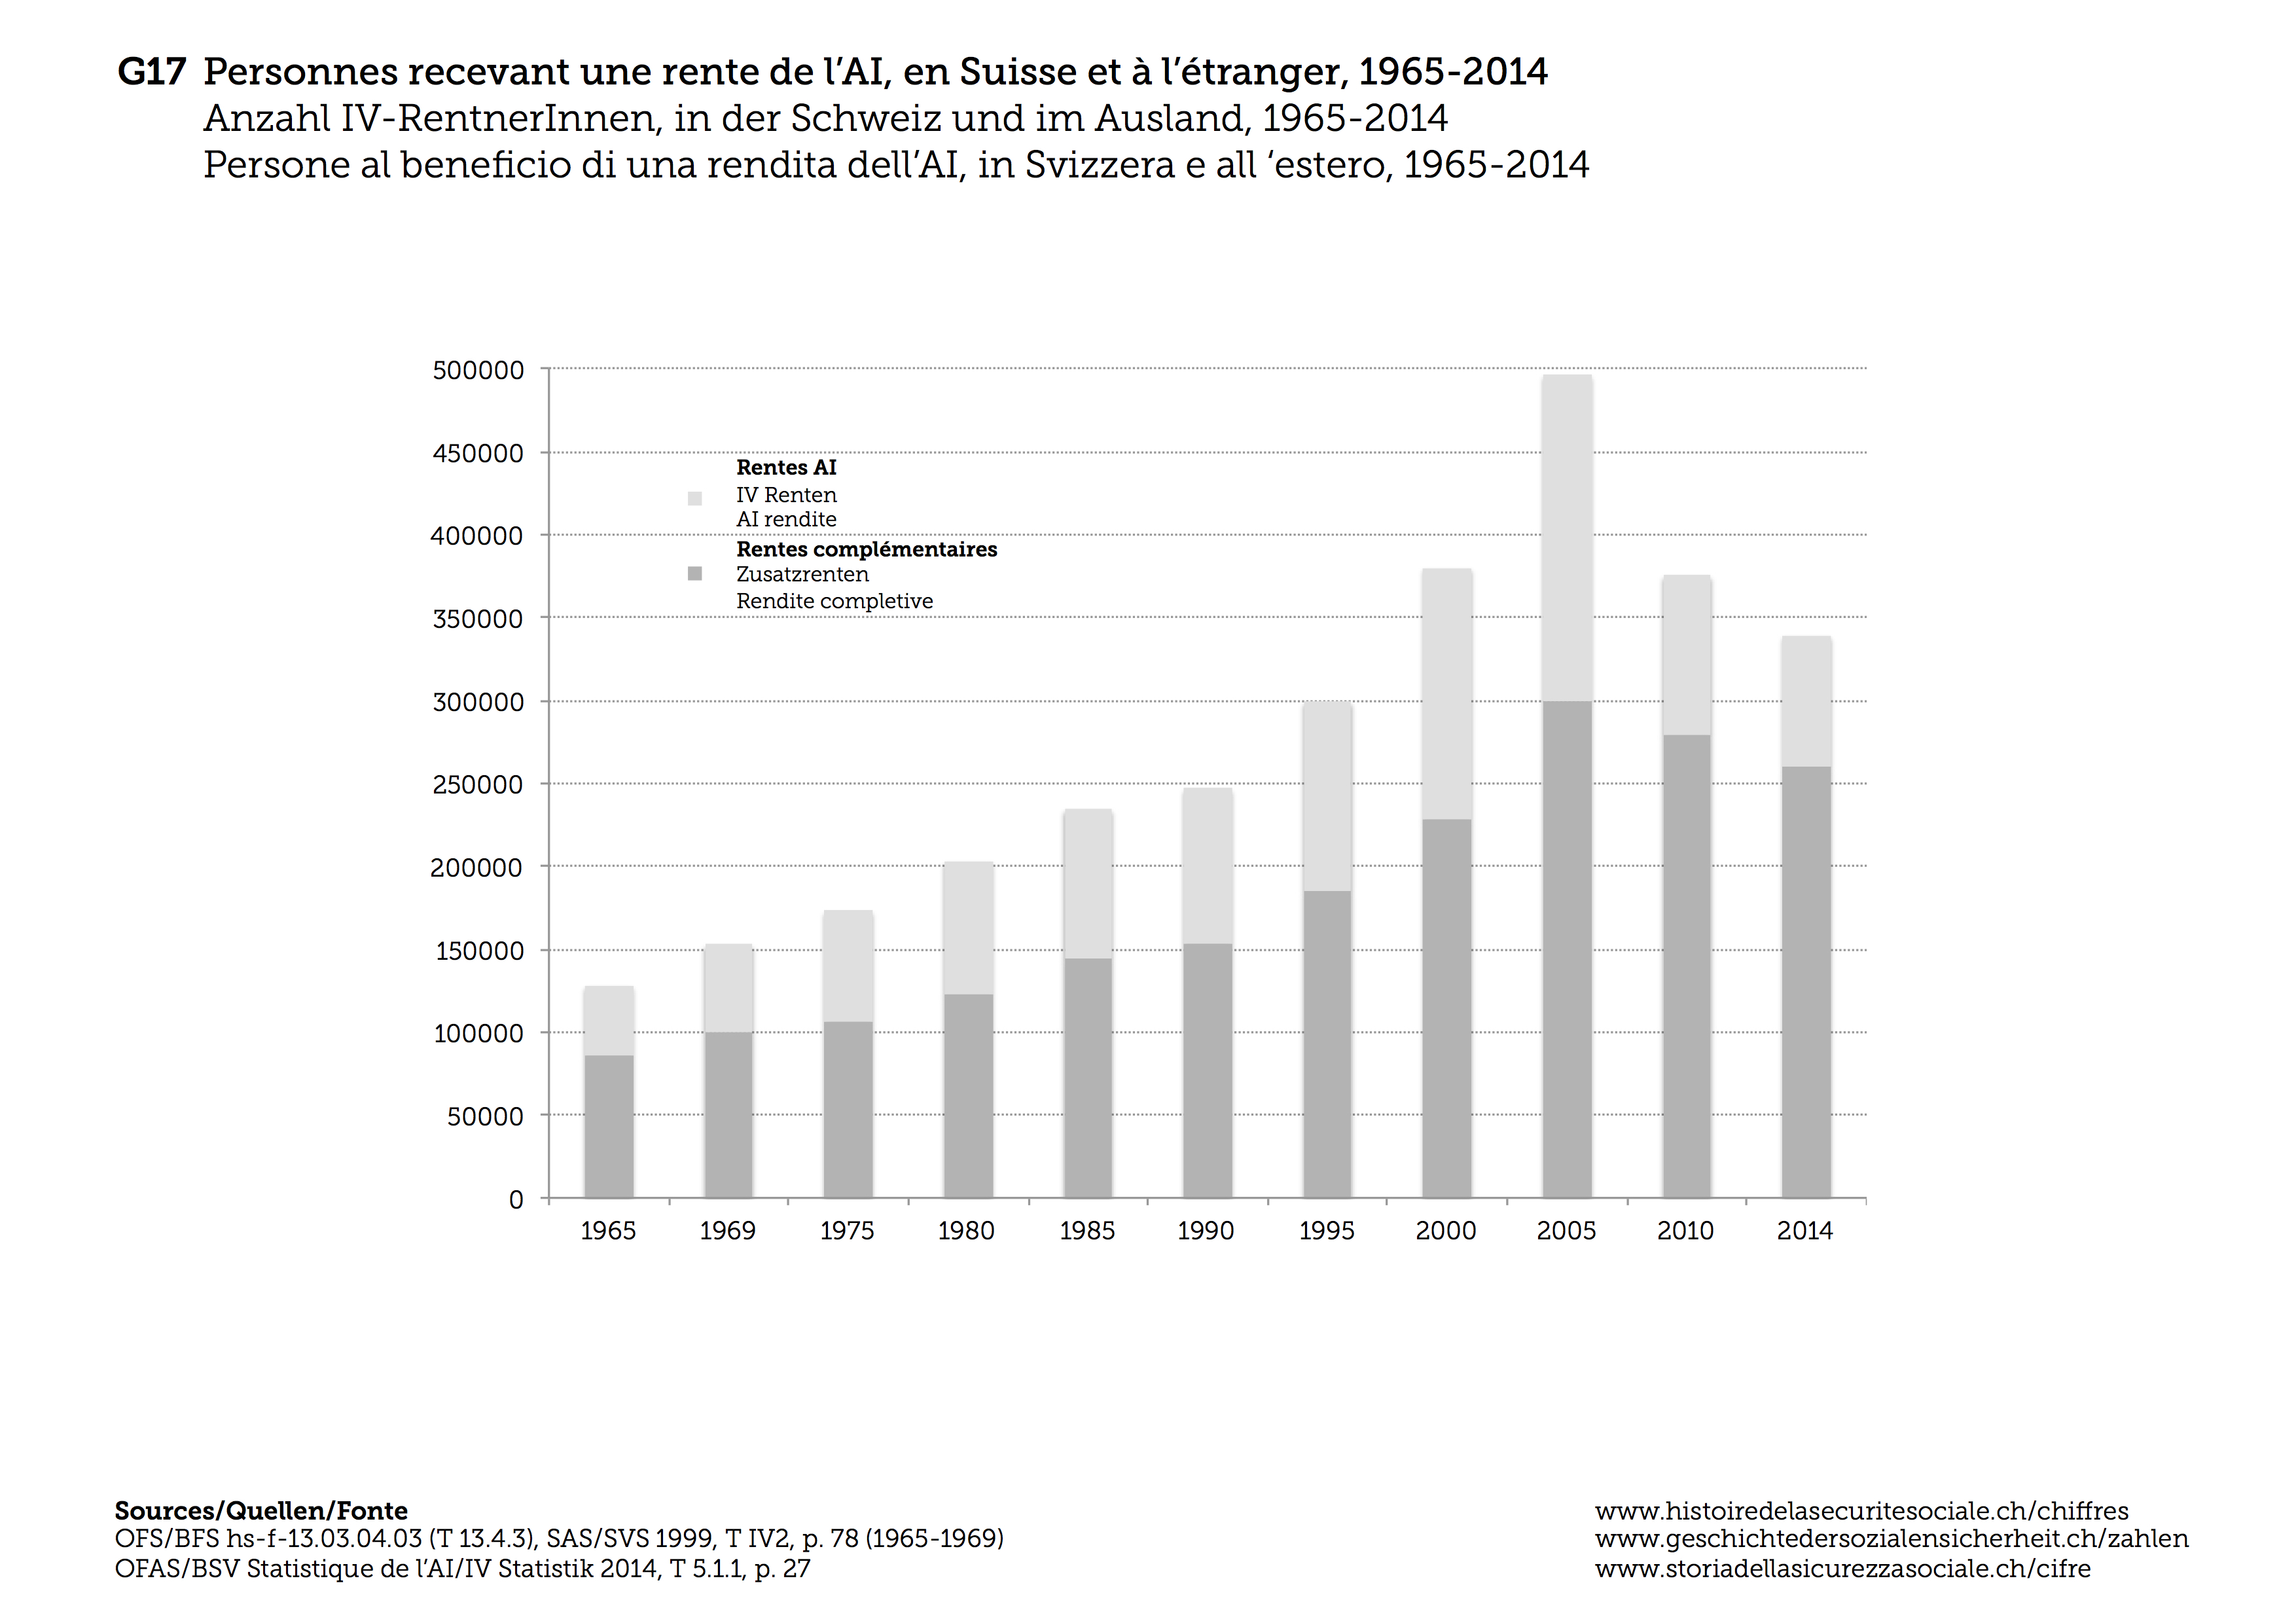
F17 Number of disability insurance (IV) recipients in Switzerland and abroad, 1960-2014
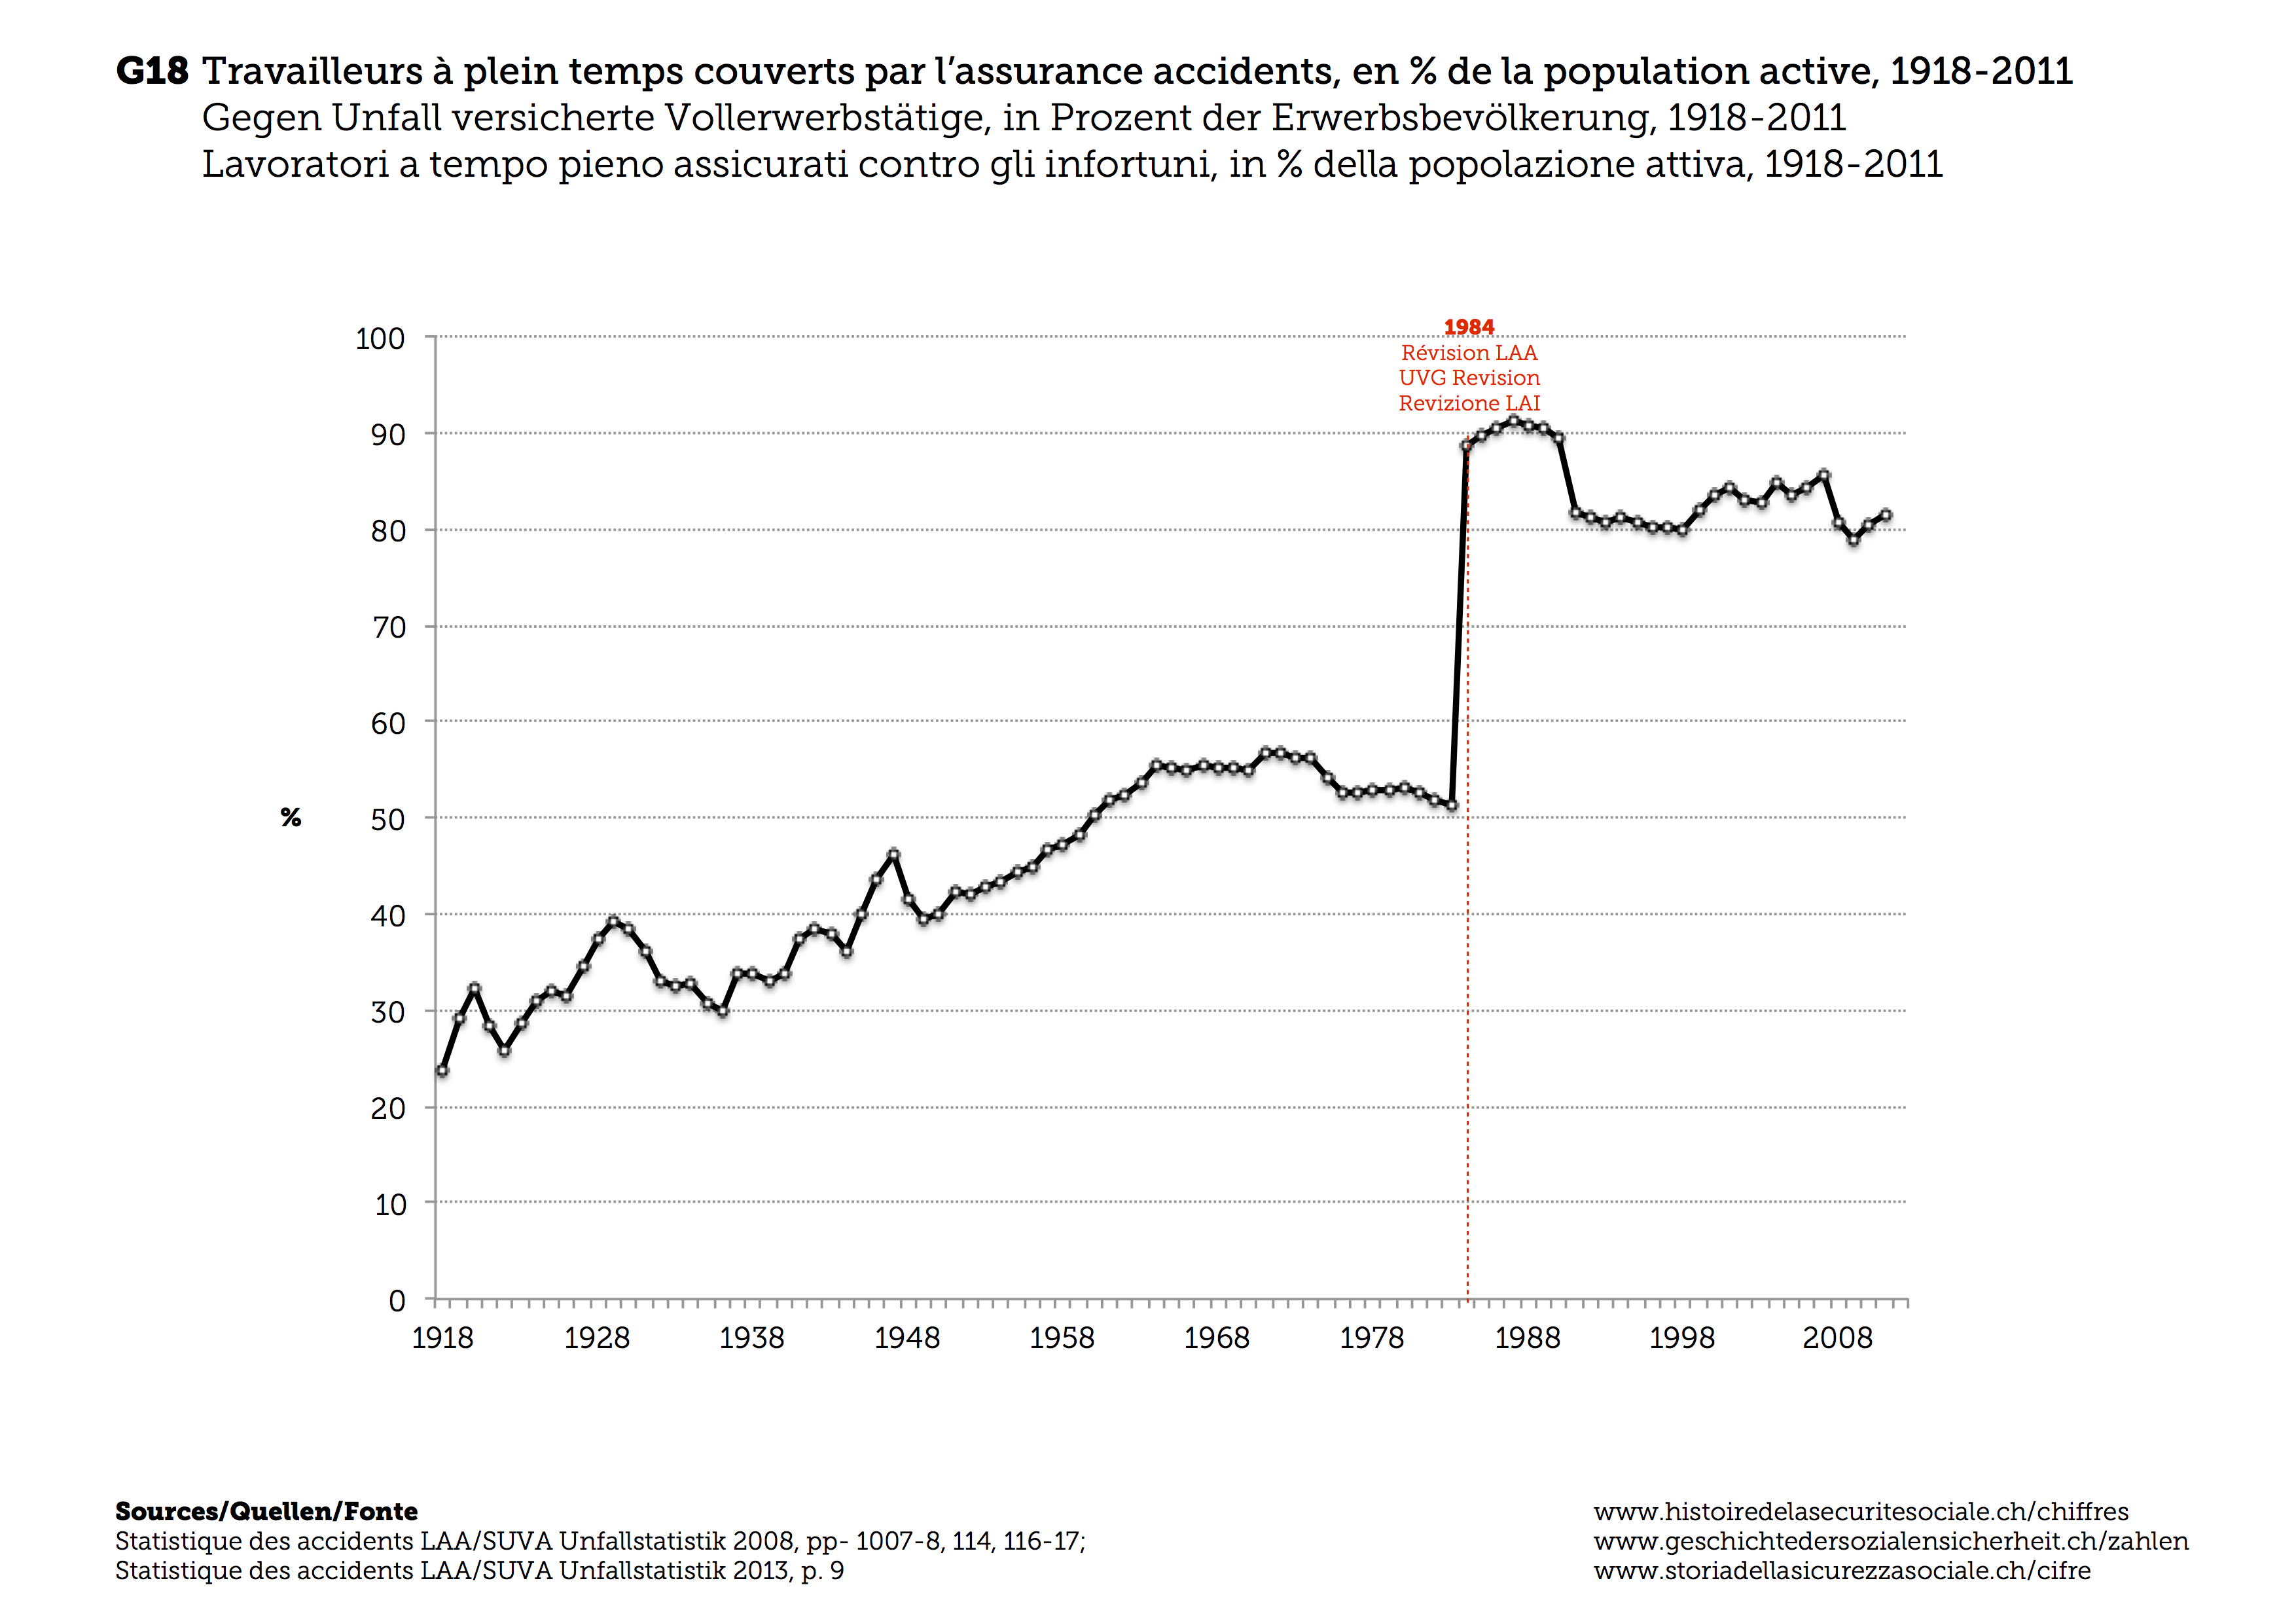
F18 Full-time workers insured against accidents as a percent of the working population, 1918-2011
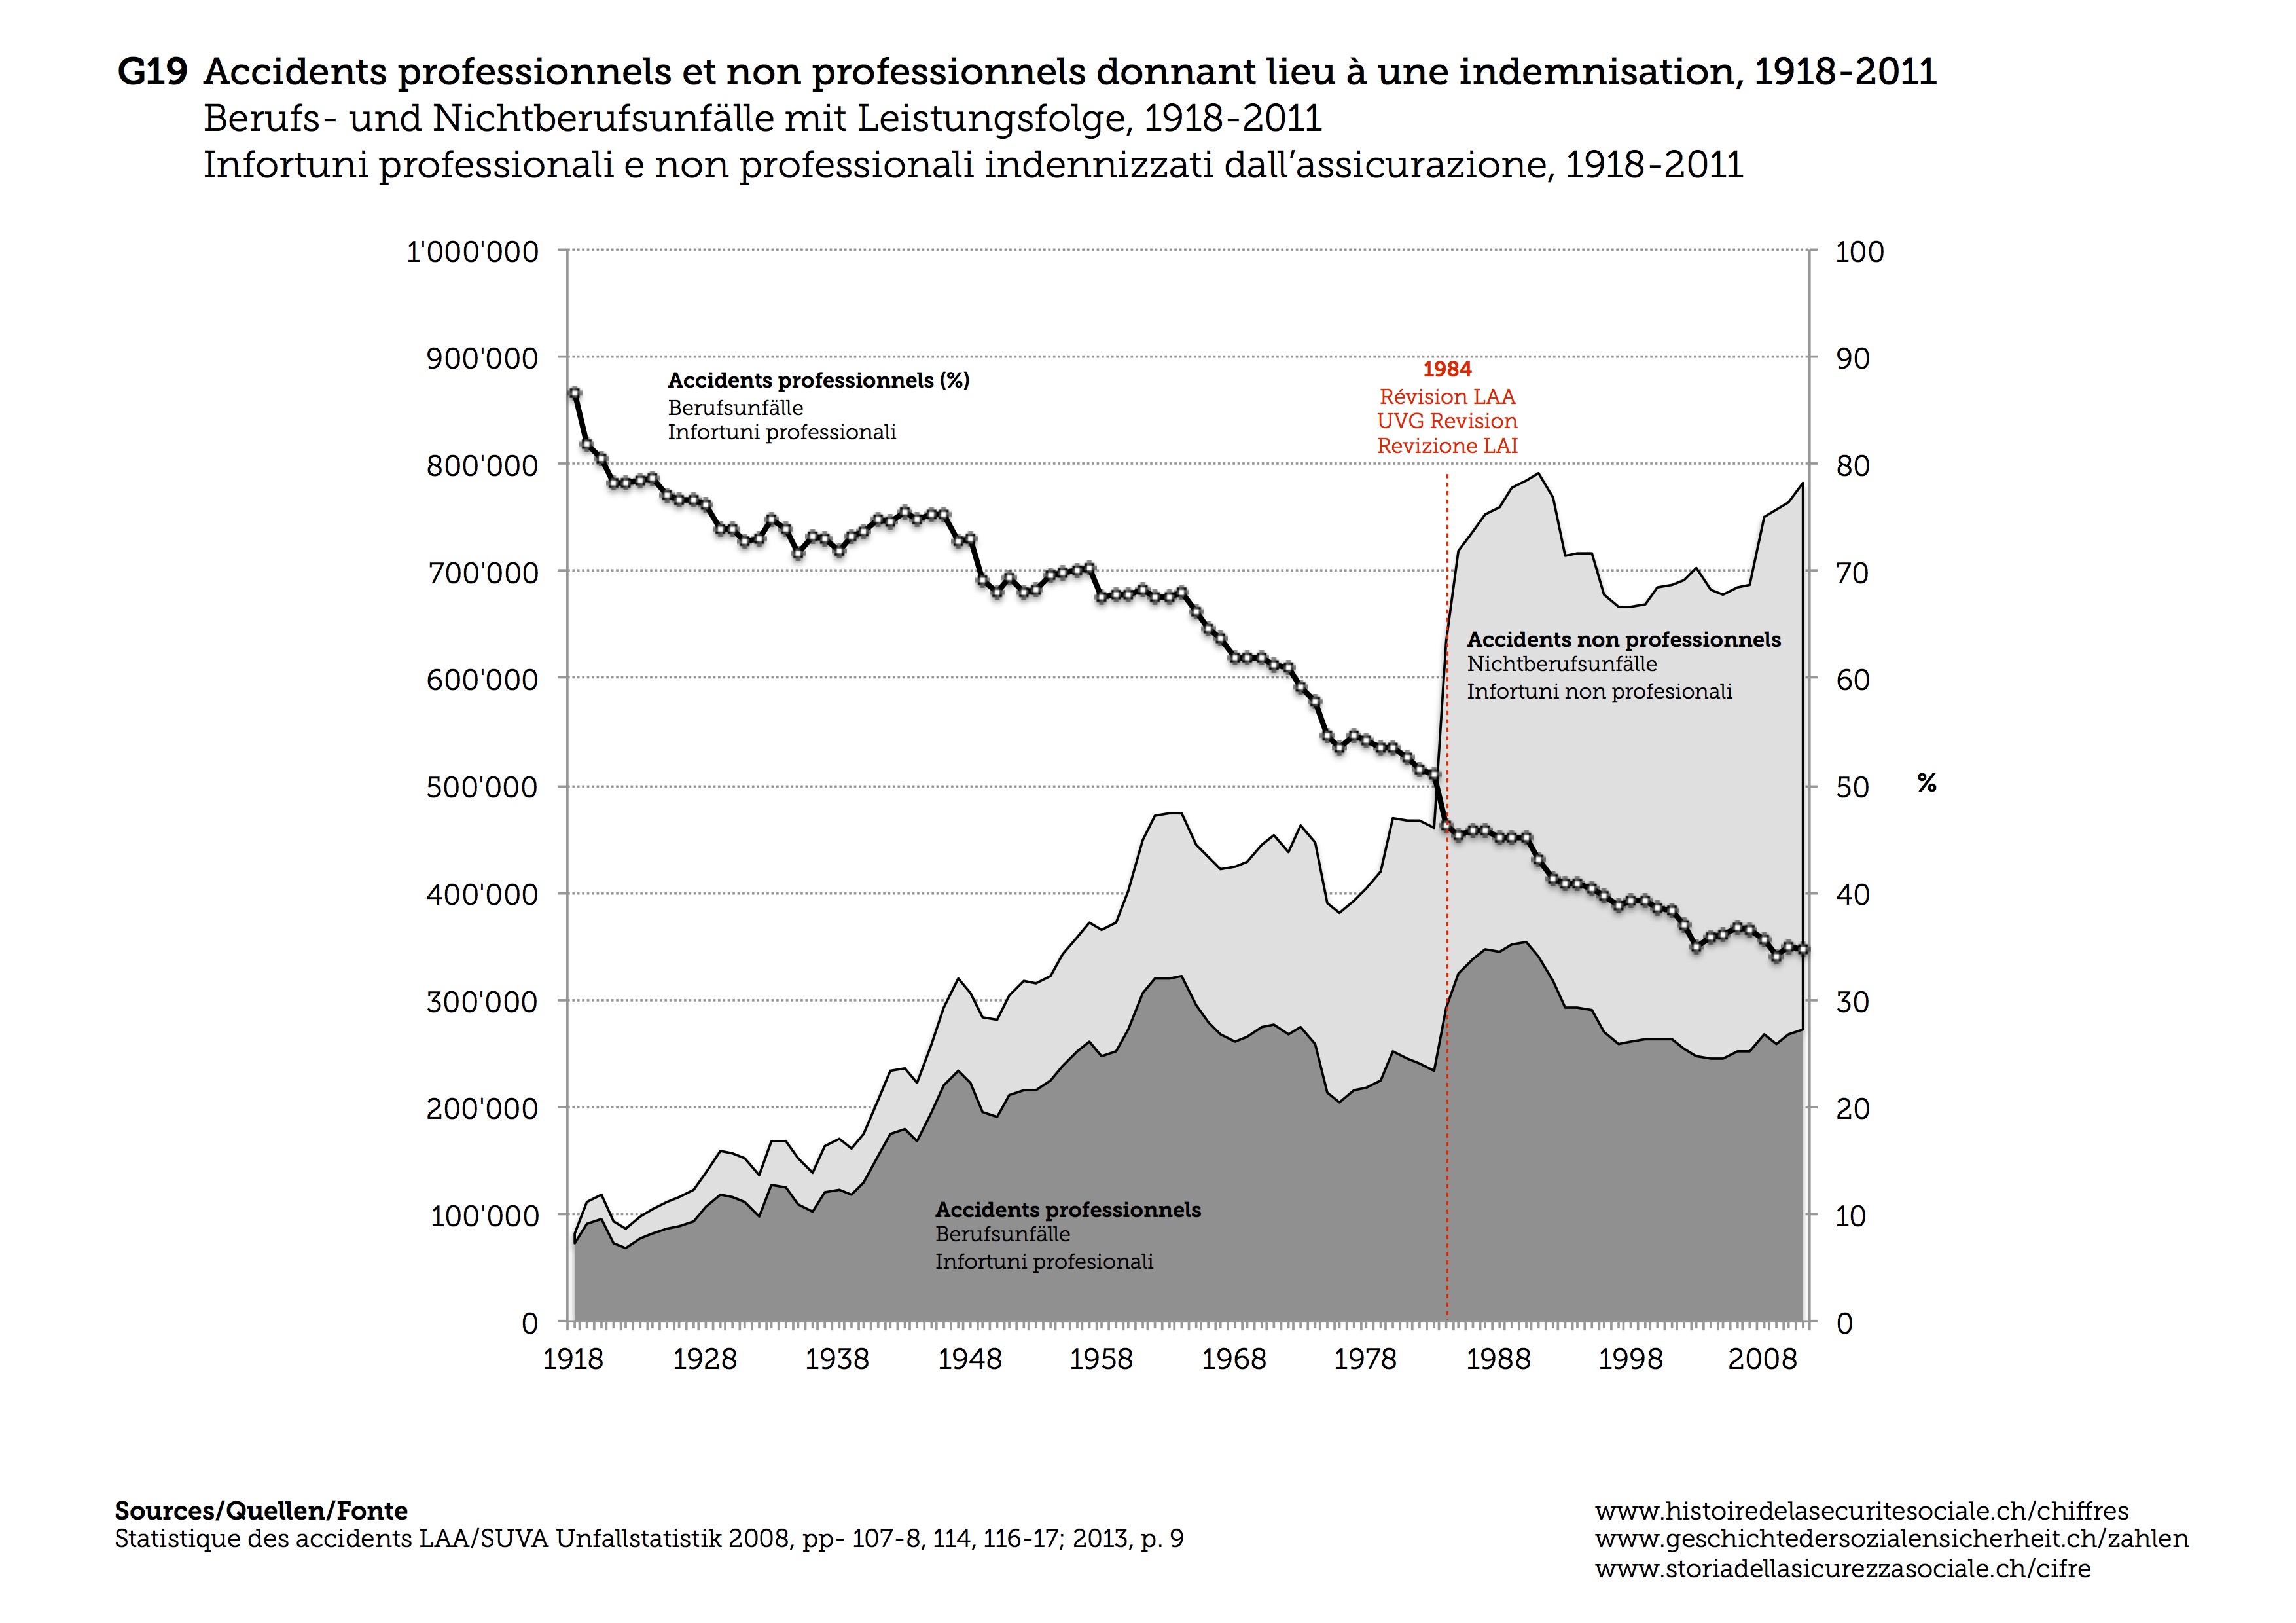
F19 Occupational and non-occupational accidents resulting in the payment of benefits, 1918-2011
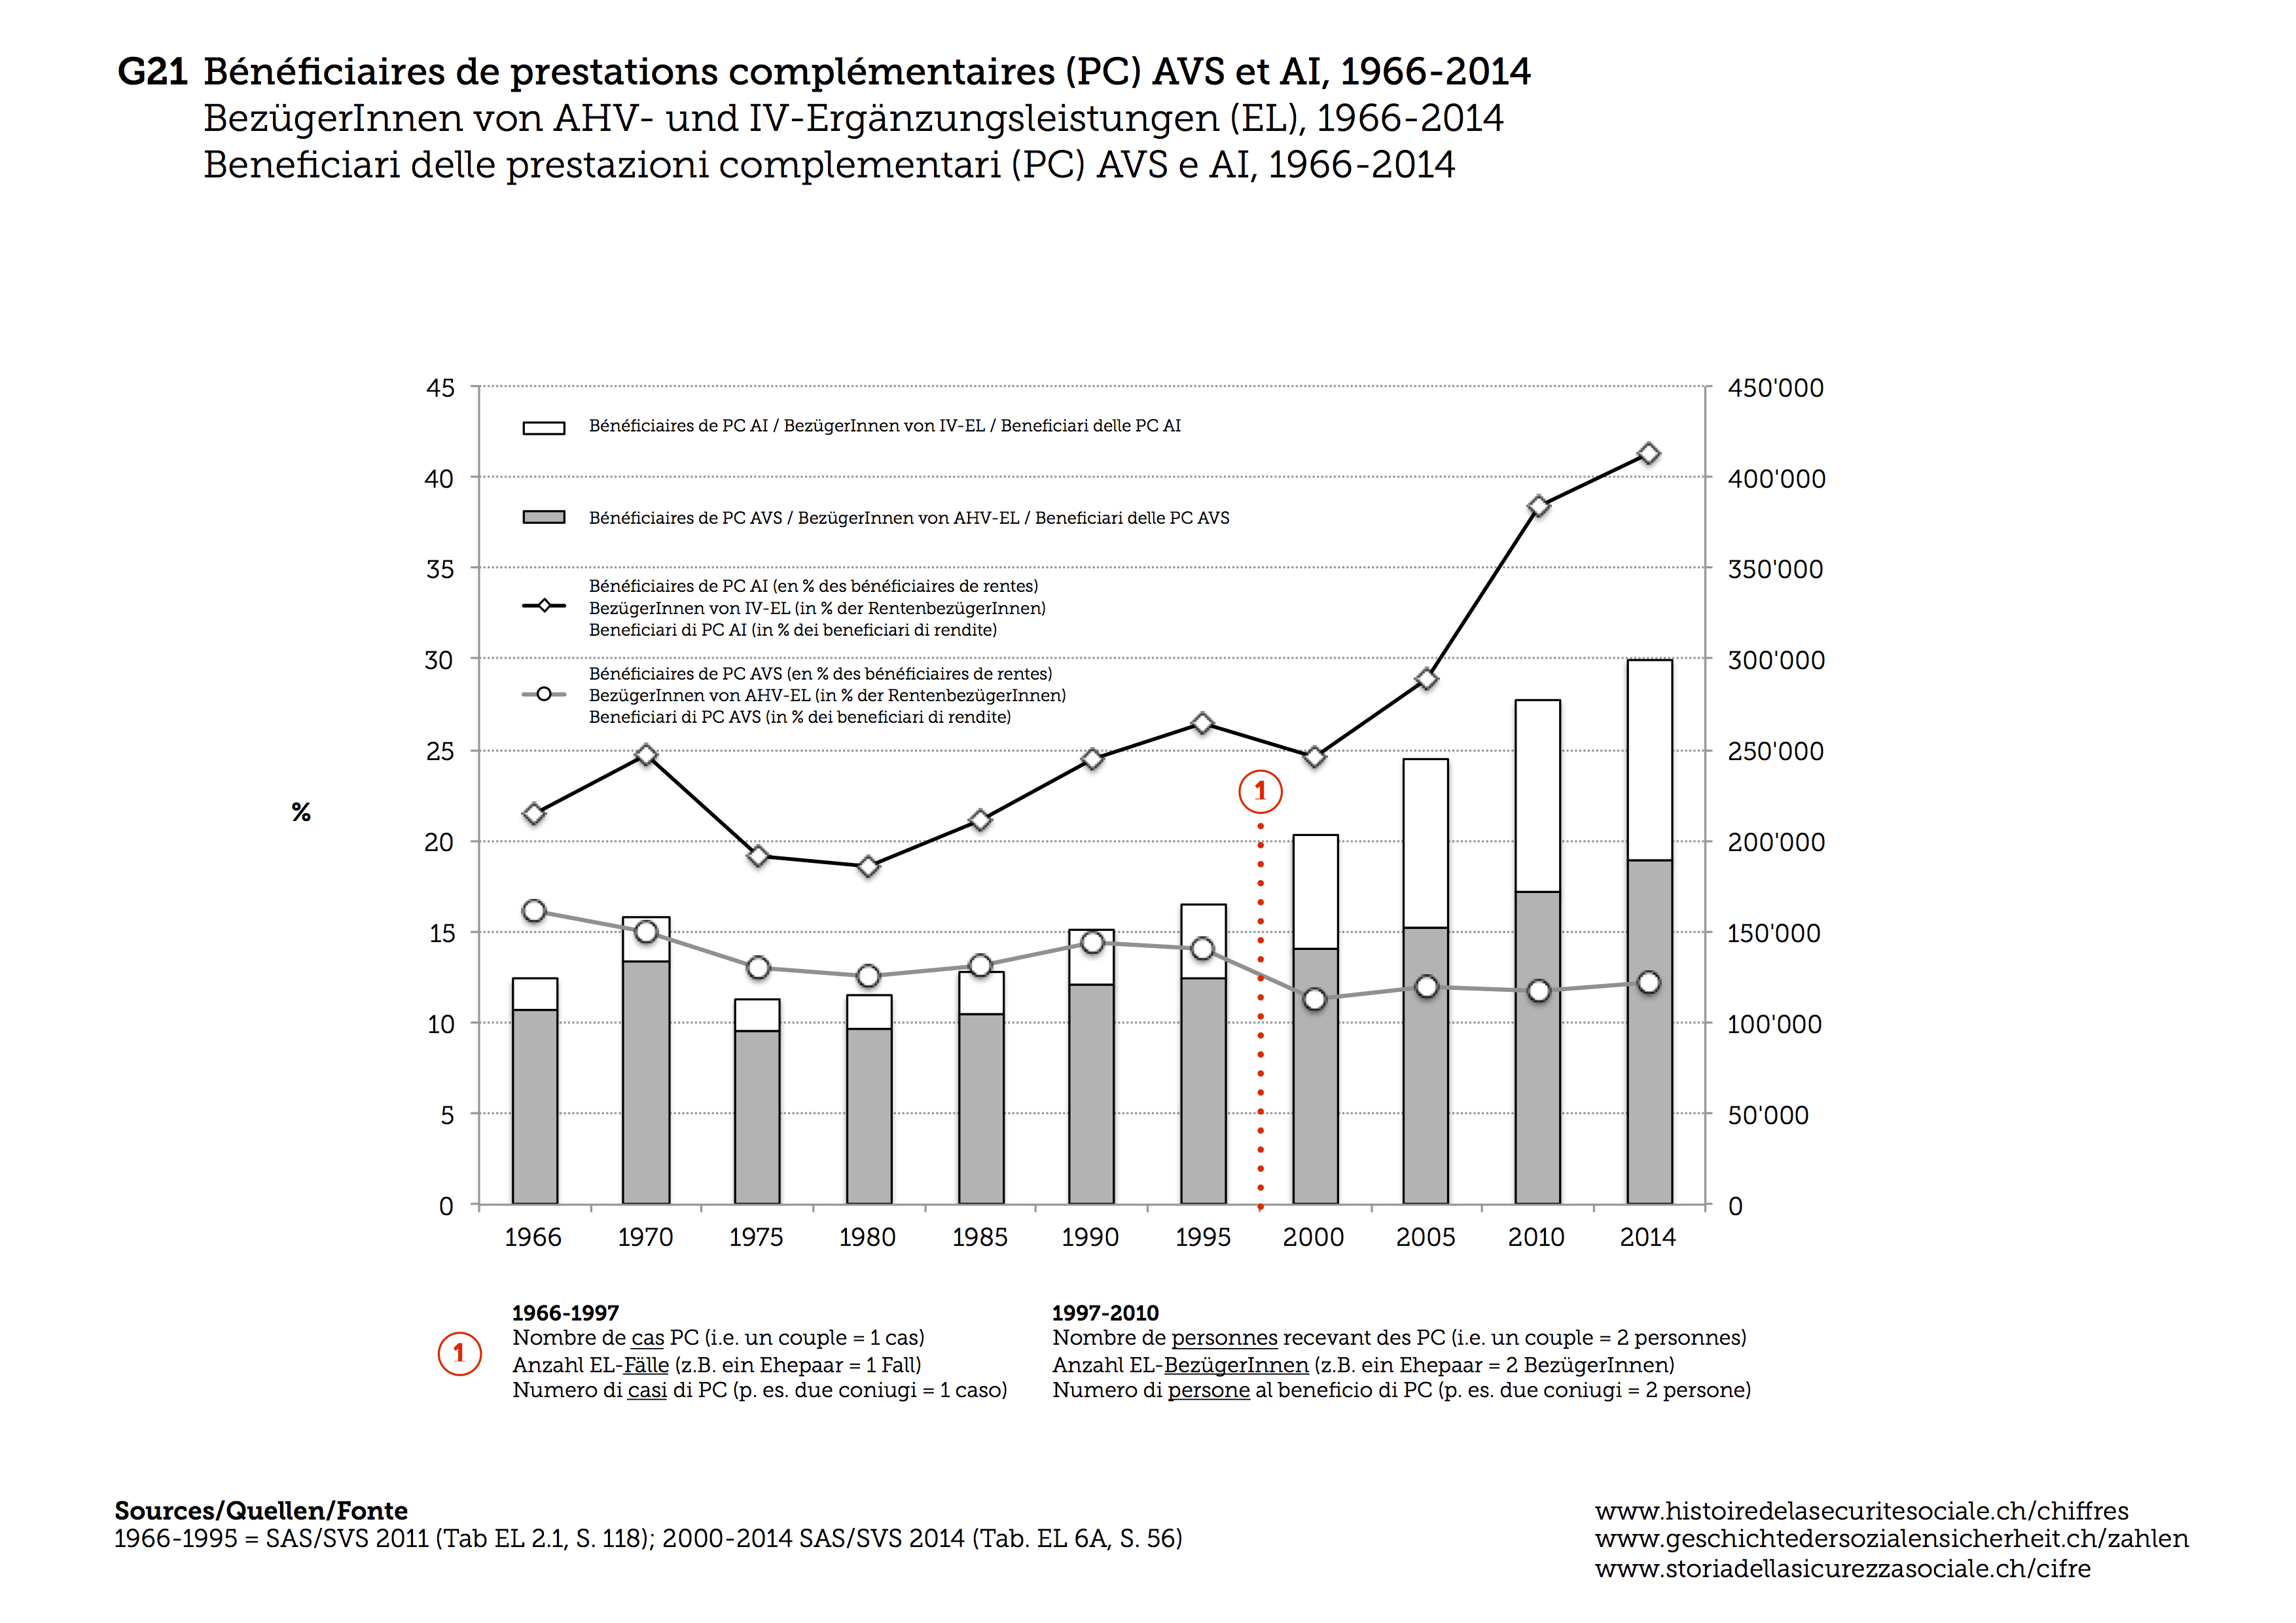
F21 Recipients of AHV and IV supplementary assistance benefits, 1966-2014